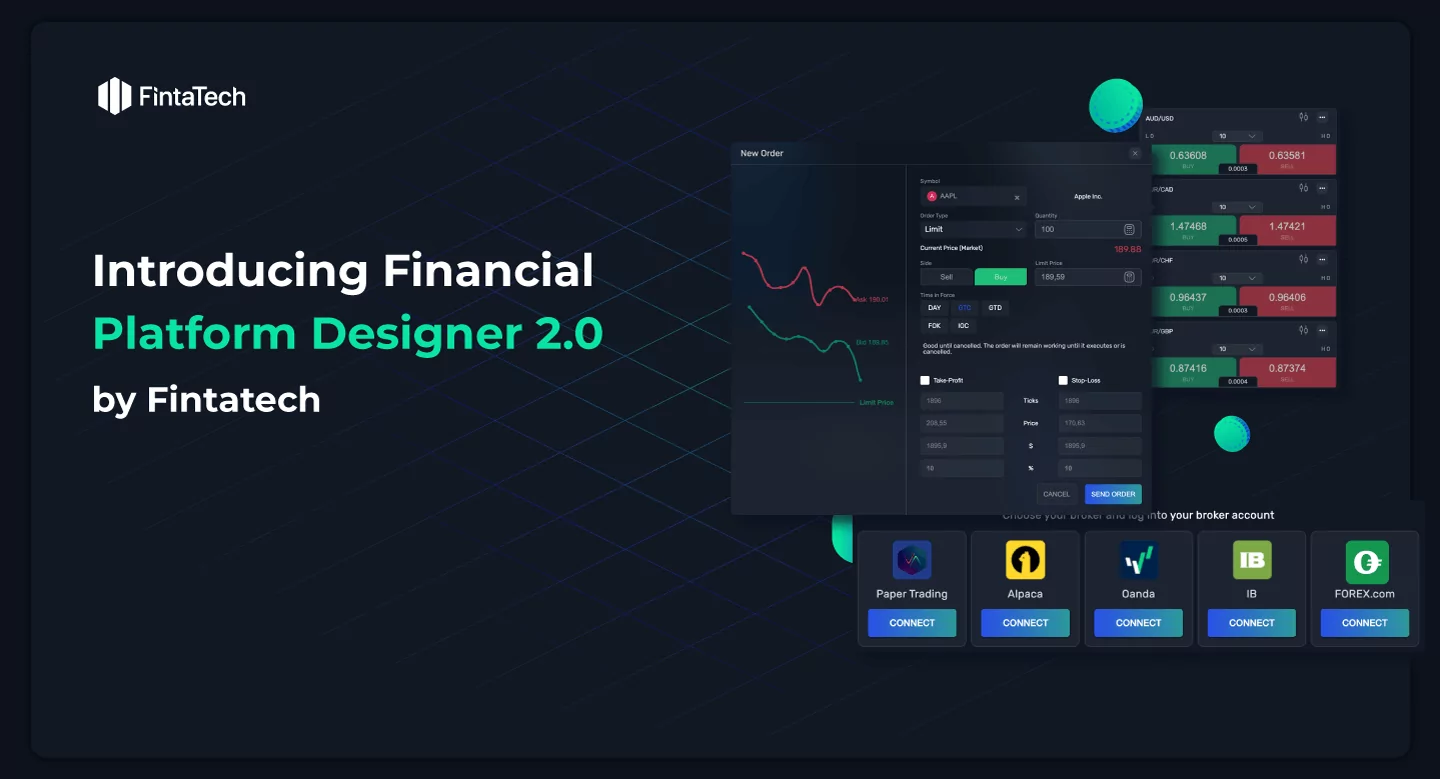
Reading:
Finance Charts and Graphs for a Successful Trading Platform

Finance Charts and Graphs for a Successful Trading Platform

It has long been understood that trading is far from being all about gut feeling and luck, as was once thought. Successful traders base their strategies on precise numbers, indicators, and data that you can learn to interpret and use correctly if you want to. However, this is only possible with modern tools that allow you to monitor and analyze the market situation with many indicators. And financing charts help with this. Read our article to find out what they are, how they are used, what are the best examples, and what you can do to implement this feature in your software for traders and brokers.

What is a stock chart?

Financial charts and graphs are nothing more than a graphical representation of the current market situation. In trading software, they usually look like multicolored charts with labels, numbers, and indicators. In addition, modern software allows traders to set additional settings and add so-called markers that help them draw certain conclusions about the current dynamics and price movements of certain assets.

The main parameters of charts are usually time and price. Each column of the chart displays the movement of a currency, cryptocurrency, or other asset’s value in a given period. Columns can display one minute, an hour, or even a day.

How does it work in practice? Let’s take Bitcoin as an example. The price of a cryptocurrency can change many times within a minute, so you may need clarification: how to display this on a chart correctly? It is pretty simple. The current value of a cryptocurrency depends on the intensity and volume of buying and selling, meaning that each new purchase or sale of even a fraction of Bitcoin will affect the price movement. Therefore, so-called candlesticks may appear on charts. They are depicted by thinner columns within the primary columns and show the lowest and highest values of the selected asset in a given period. The actual price at each moment is shown in the main colored column. In addition, charts usually show a period in green when the price was higher than the previous period. And the red color indicates the period when the price of an asset was lower than the previous period. 

It is essential that a finance chart requires many indicators to make it convenient for a trader to use it. All these indicators work based on constantly updated data from the market.

What should I consider when reading charts?

A finance chart template is essential for every trading platform because it is based on it so that you can make some predictions and conclusions about the current market situation. Otherwise, trading is a guessing game — but it would not be productive. 

That’s why there are such essential market circumstances that a chart can tell you about:

  • Volatility. In the moments when the price of an asset has no clear direction of growth or decline, a period of “turbulence” begins, when the price goes up or down by a tiny percentage over a certain period. Charts help to visualize all this very clearly. Experienced traders do not recommend placing orders during such a period, as it can be difficult to predict which way the price will eventually go — up or down. But for neutral strategies, this time is ideal because they work best when the difference between the highest and lowest price for a certain period is not very large.
  • Rapid price growth or decline. The charts usually have a so-called envelope – it shows the average price over a certain period. Notably, this envelope often becomes the level within which volatility occurs. And if the price eventually “breaks through” this envelope, i.e., moves above or below, it indicates that the price will either rise or fall in the future, respectively. And this moment can be predicted with high probability: if the price column hits this line twice on the chart, the price movement will likely reverse. 
  • Trends within an hour, day, or month. In its normal state, the economy is constantly developing. This means asset prices should grow, which is clearly visible on longer-term charts than five-minute ones. However, the market price can rapidly jump up or down due to certain cataclysms or financial crises. Referring to the example we used earlier, in April 2021, Bitcoin was worth more than 60 thousand dollars. However, at the beginning of 2023, its price fluctuates between 26 and 30 thousand dollars each.

What does this information give traders? The ability to build a strategy and action plan. There are different types of strategies: long, short, and neutral. Long is designed for the price to rise. A short is designed for the price to fall. And neutral works well when the market is experiencing a period of volatility.

How to create trading software with convenient charts?

We have already realized that financial charting is essential for any trader. Charts and diagrams are indispensable tools in the work of professional traders, and when it comes to an algorithmic trader, they are essential. So how do you create software that will provide high-quality and convenient information about the market situation?

  • Ready-made libraries.

If you analyze stock charts of websites, you will see similar patterns in the information displayed. This is due to two reasons. First, the basic set of functions must be the same because these functions are what traders use most often. Secondly, given the first factor, ready-made libraries can now be used when developing your software. This speeds up the process and makes development much easier because you do not have to reinvent the wheel. At the same time, you shouldn’t worry that you might be similar to others. Every trading software has identical patterns, but it wins its market share precisely because of the differences from competitors. You can build your app or website in such a way that it provides all the general information you need but has peculiarities that will interest your target audience.

  • Visualization.

In general, all charts are built based on digital data that is constantly changing depending on market fluctuations. To make the information understandable for the user, you should pay great attention to the display design. To do this, you will need the services of a UX designer who can create the most user-friendly interface. In particular, it is about ensuring that what a person sees on the screen is intuitive and that the data they expect to see is in prominent places. Working on naming and briefly explaining all functions is also important. This is necessary to ensure that even newcomers to trading can easily figure out what’s what.

  • The ability to attract third-party resources. 

In their work, professional traders usually rely not only on the charts provided by the software of a particular exchange but also on independent resources. Given that the market for stocks, currencies, cryptocurrencies, and other assets is global, third-party resources are indispensable. We are talking about many tools, statistical services, and other resources that reflect the current market situation.

What is the essence of algorithmic trading? A person sets the parameters by which the software automatically buys and sells assets. This is one of the most popular branches of trading nowadays, which allows for reducing human involvement in the trading process by several times. For example, when the price of Bitcoin falls by $100, the software automatically buys, and when the price rises again, it sells. Traders can earn large amounts of money on these market fluctuations, especially if the exchange allows placing orders with x20 odds. And algorithmic trading also works thanks to stock charts because trading sets parameters based on a visual representation of price fluctuations in the market.

Who can help you create trading software with user-friendly charts?

If you want to develop software with stock charts, you can contact Fintatech. We create trading software of varying complexity and have extensive experience in this field. Our Trading Chart Designer will speed up the development while leaving much room for customization. And our team will choose the most optimal solution and be ready to develop modern software for you and your traders!

To find out more details, sign up for a consultation. We will be happy to develop the perfect software solution for you!

Related Stories

February 23, 2023

How To Build a Trading Platform

March 2, 2023

How to make automated trading software

Arrow-up
Display#1
  • Twitter

  • Linkedin

  • Facebook