In financial technology clarity and performance are non-negotiable. When building a trading platform, brokerage dashboard, or FinTech application, the decision of how to display market data is critical. A common mistake is to treat all “charts” as the same, but the reality is that different use cases demand different tools. A chart designed for a high-level market overview is fundamentally different from one built for in-depth, real-time technical analysis.
Choosing the wrong tool can lead to a cluttered user interface, poor performance, or a lack of the analytical depth your users require.
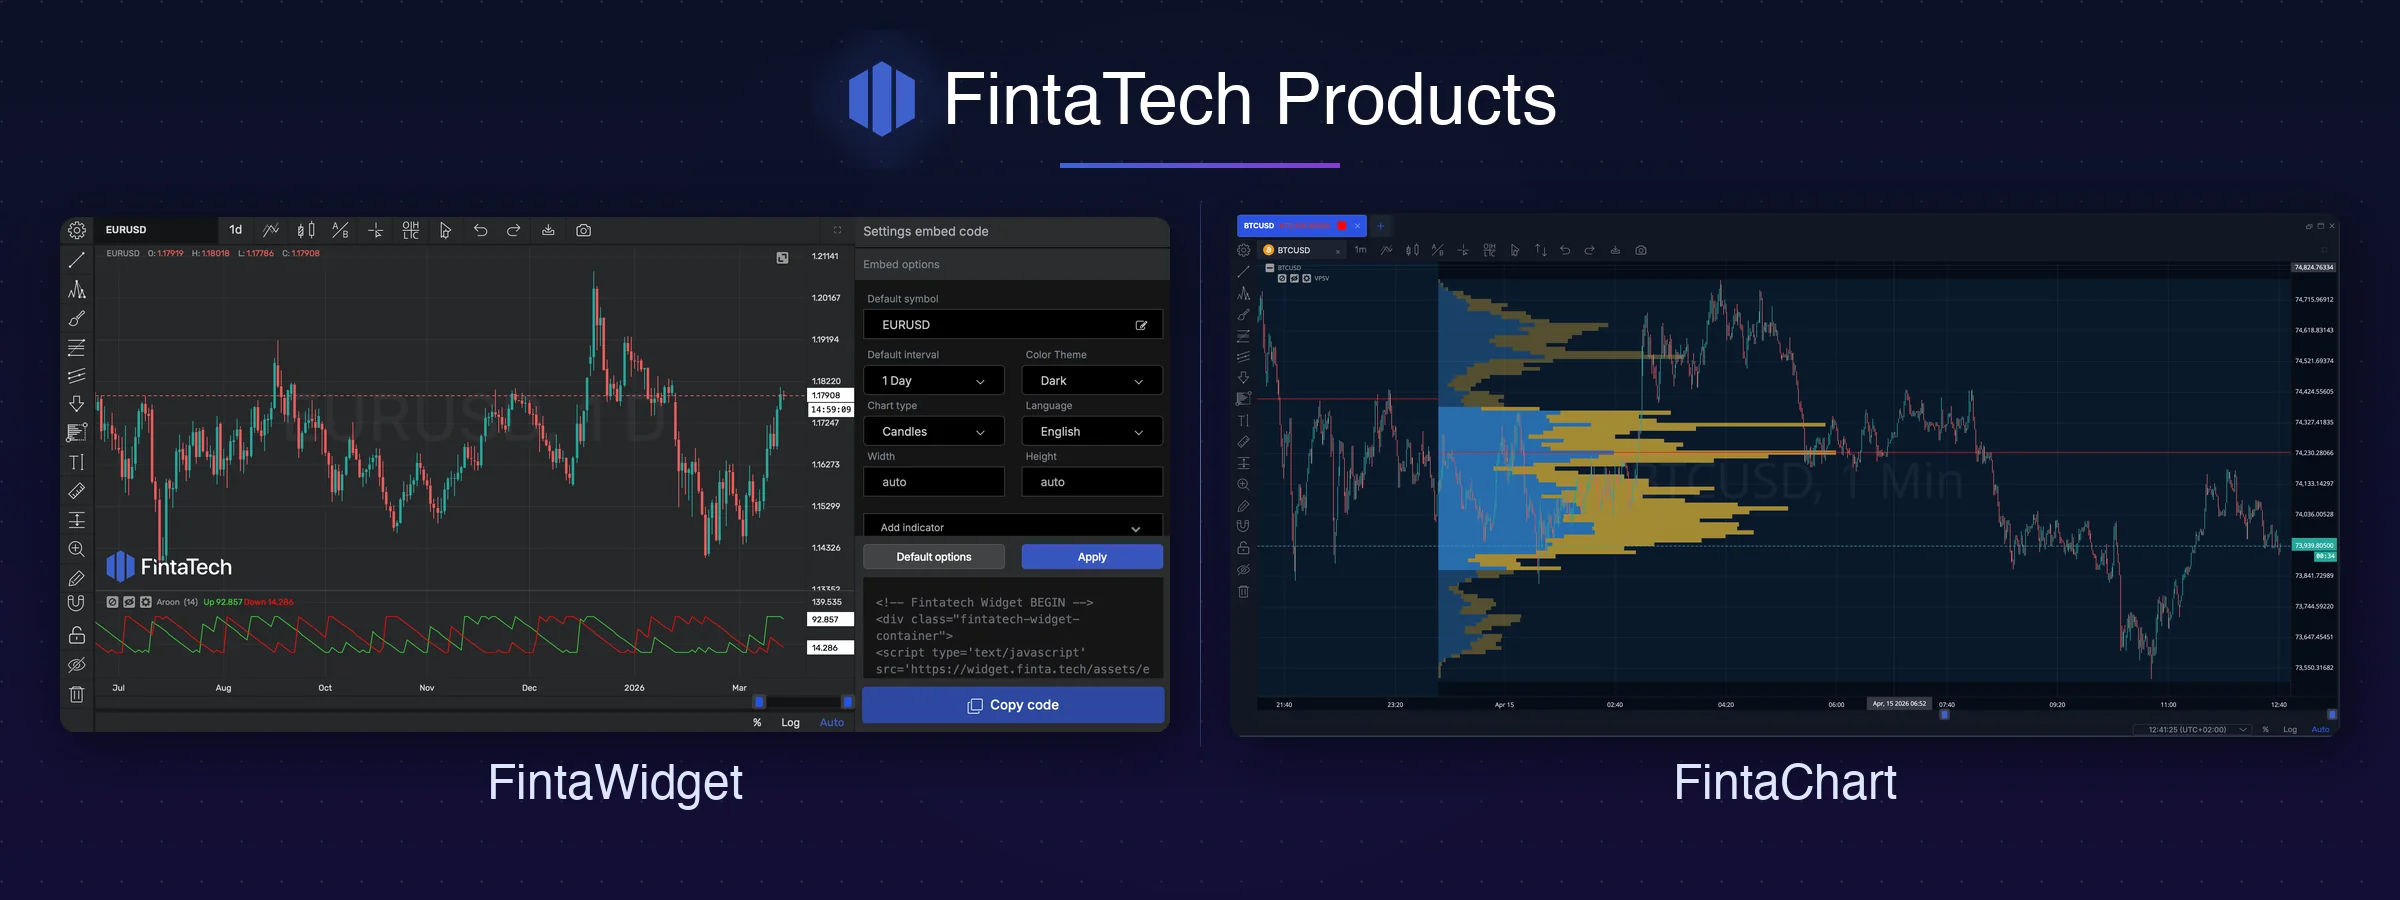
At Fintatech, we’ve engineered two distinct solutions to address this: FintaChart and FintaWidget. This guide will help you understand their specific purposes so you can choose the right component to create the best possible experience for your clients.
FintaWidget: Lightweight & Focused Visualization
Think of FintaWidget as the perfect tool for a quick, focused data snapshot. It is designed to be incredibly lightweight, fast to load, and easy to embed when you need to display a simple chart without overwhelming the user with features.
FintaWidget is the ideal solution when your platform needs to:
- Display a Market Overview: Use it to show a collection of “sparkline” charts on a homepage, giving users a quick, scannable view of market movements without consuming significant page resources.
- Enhance Static Content: Embed a simple, non-interactive FintaWidget into a news article, blog post, or research report to provide clear, visual context for a market event.
- Provide “Quick-Look” Charts on Public Websites: Perfect for a landing page or marketing site where you need a clean, fast-loading, and visually appealing chart to display an asset price or a simple trend to attract new users.
- Power Internal or Secondary Dashboards: Use it for internal monitoring tools or secondary dashboards where your team needs a quick, at-a-glance view of a key metric without the complexity of a full trading interface.
- Build Secure Client Portals: For use cases like a client portfolio overview or a “my account” page, FintaWidget delivers a professional chart showing historical performance or account value over time, providing essential information in a secure, read-only format.
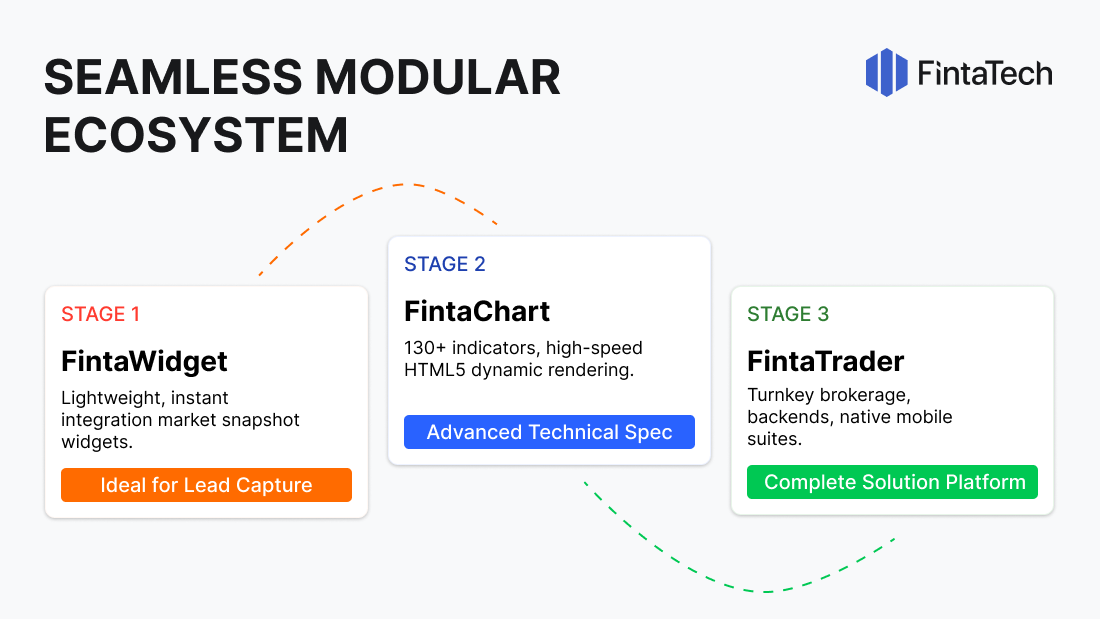
In short: Choose FintaWidget for speed and simplicity in high-level data display. It serves as the perfect entry point into the Fintatech ecosystem, with a seamless upgrade path to FintaChart’s full analytical suite as your platform’s needs evolve.
FintaChart: The Visual Data Engine for Your Trading Platform
FintaChart is our premier, full-featured financial charting library, making it the ideal engine for any professional trading or financial analytical platform. It is a comprehensive, high-performance solution designed for users who need to perform a deep dive into market data with a complete suite of professional tools.
FintaChart is the essential tool when your platform needs to provide:
- Core Professional Trading Interface: This is the main, active charting environment where your most demanding users will spend their time. It’s engineered for real-time data streaming, advanced analysis, and direct trade execution capabilities.
- A Comprehensive Technical Analysis Suite: With over 130 pre-built technical indicators, a full collection of advanced drawing tools (like Fibonacci and Gann), and customizable indicator settings, FintaChart provides the deep analytical power that professional traders expect.
- Advanced, Multi-Chart Layouts: Empower your users to create their own custom trading dashboards. FintaChart supports complex, multi-chart arrangements, allowing for the simultaneous analysis of different assets, timeframes, or strategies in a single, unified view.
- Full Interactivity and Customization: This is a fully interactive “cockpit.” Users can create their own chart templates, save layouts, customize color schemes, and tailor the entire analytical experience to their personal workflow, leading to higher user engagement and retention.
- A Foundation for Proprietary Tools: FintaChart’s robust API allows your development team to build your own proprietary indicators or analytical tools on top of our proven engine, giving your platform a unique, competitive edge that is impossible with more limited solutions.
In short: Choose FintaChart when your users demand a no-compromise, professional-grade analytical experience with maximum power and flexibility.
At a Glance: Which Tool for Which Job? (Expanded 10-Point Version)
| Attribute | FintaWidget | FintaChart |
| 1. Primary Use Case | Lightweight Overviews, Dashboards | Core Trading & Deep Analysis |
| 2. Interactivity | Low to Medium (View-oriented) | High (Full user interaction & control) |
| 3. Analytical Tools | Limited / Basic | Extensive (130+ indicators, drawing tools) |
| 4. Ideal User Persona | A passive viewer needing a quick look | An active trader or analyst requiring deep control |
| 5. Data Handling | Optimized for historical or snapshot data | Optimized for real-time, high-frequency streaming |
| 6. Customization | Basic theme and color adjustments | Deep UI/UX customization, templates & layouts |
| 7. API & Extensibility | Simple embed with basic configuration | Robust API for proprietary tool development |
| 8. Performance Footprint | Extremely lightweight and fast-loading | High-performance, feature-rich engine |
| 9. Best For | Simplicity and speed | Power and professional features |
| 10. Strategic Role | An entry point into the ecosystem | The cornerstone of a professional platform |
Conclusion: The Right Tool for a Superior Experience
Building a world-class financial platform means selecting the right tool for the right job. By understanding the distinct purposes of our lightweight FintaWidget and our powerful FintaChart library, you can create a user experience that is perfectly tailored to your clients’ needs—providing simplicity where it’s needed and unmatched power when it’s required.
Explore the power of our premier charting library. See the FintaWidget Demo

Twitter
Linkedin
Facebook