Finatech’s work is heavily reliant on the practice of continual improvement. We try our best to suit the needs of our users because the results of traders’ operations are dependent on our software.
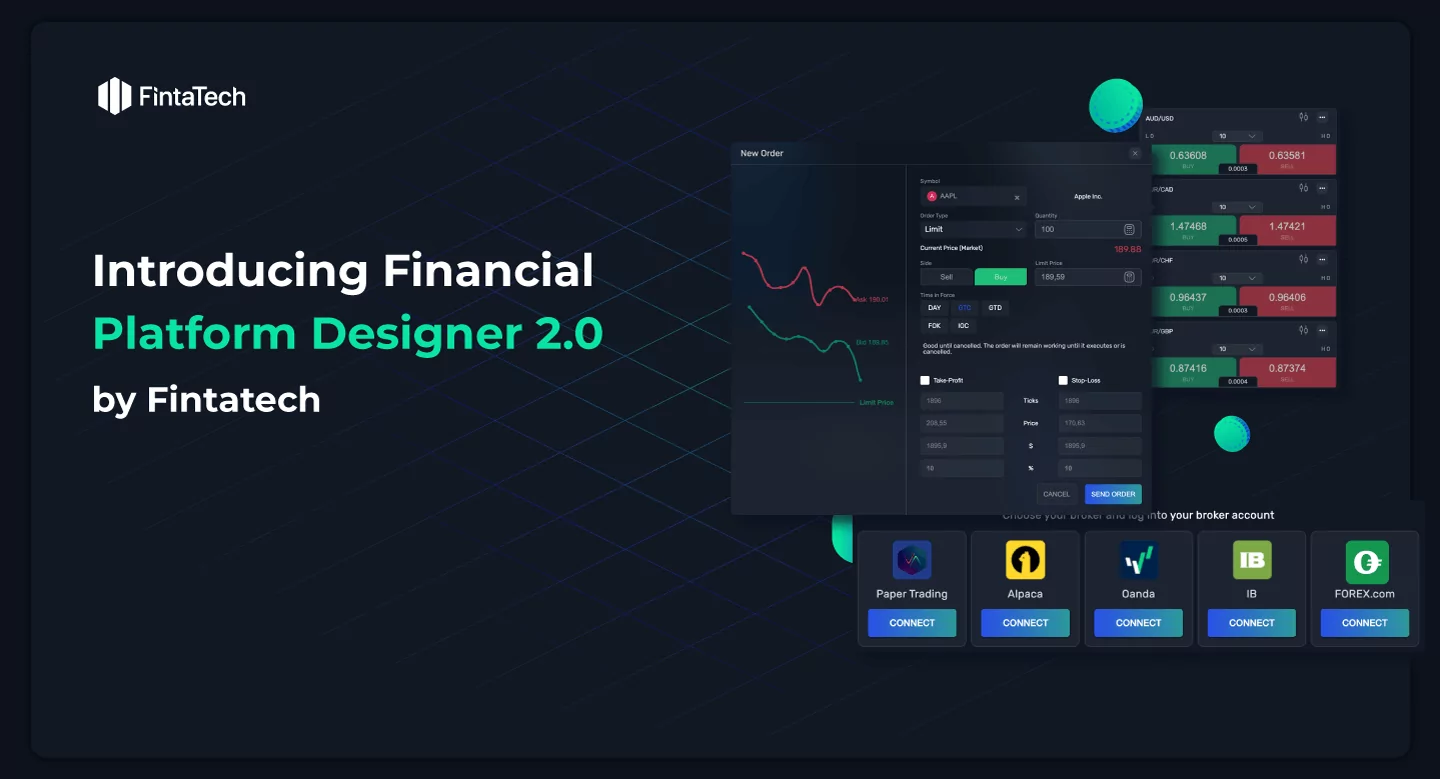
We’ve amassed many changes and a lot of fascinating and helpful advances in our software, which is why we’re excited to release Trading Chart Designer 2.0. Your business will benefit from a solution that is even faster, more productive, and more functional.
Read on to learn more about our enhancements in Trading Chart Designer 2.0, including:
- New indicators;
- Fintatech Scripting 2.0;
- Fintatech Paper Trading connection;
- Fundamental data view widget;
- IEX cloud data connection;
- Overall speed improvements.
Fintatech Scripting 2.0
Fintatech Scripting is a tool allowing customers to write their personal scripts; basically, bots that can trade independently. At first, traders establish the set of rules and strategies which will be executed by the program. In version 2.0, we:
- Improved high-speed backtesting engine built on the latest .NET Core technology;
- Added new indicators and corresponding strategy methods to make it easier to plot indicators in strategy code;
- Added new performance metrics and optimization methods;
- Several other minor fixes and enhancements.
New indicators.
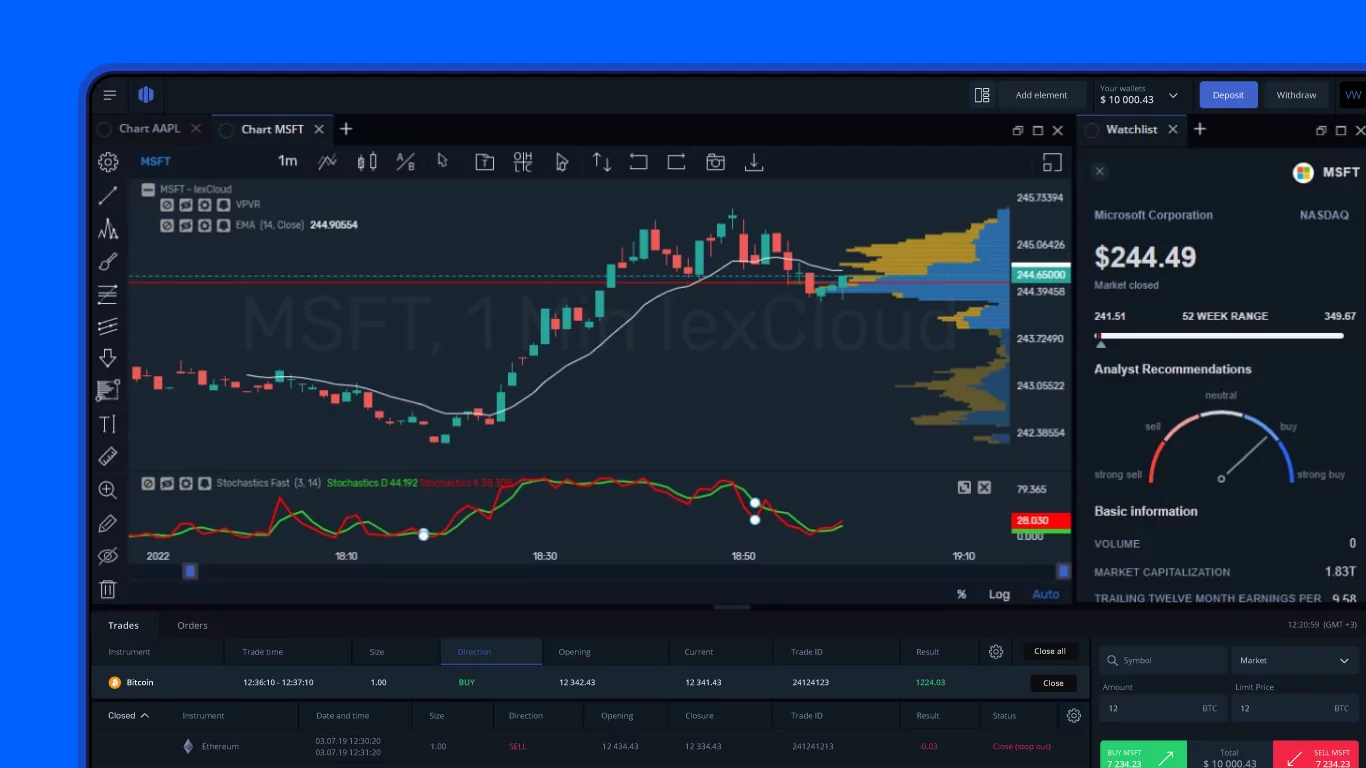
Traders may use over 130 Technical Analysis Indicators on our platform to do the finest market analysis. We’ll keep researching and adding new indicators, so that traders may make even more precise and better decisions. We introduced numerous new indicators to Trading Chart Designer version 2.0, including volume profile indicators: daily profiles, and visible range profile indicators.
Visible range profiles indicators (VPVR)
Visible range profile indicators, or VPVR (Volume Profile Visible Range) are the basic volume profile tools. In financial chart analytics, a profile is a property of price level activities. The profile entails the creation of a bar chart along the graph’s vertical axis, with each bar representing data for checking.
VPVR automatically shows the volume traded at the price level from the candles shown on the screen. It’s a chart histogram that shows price levels based on volume and, in essence, offers a clear indicator of supply or demand at a certain price rather than volume across time.
Daily profiles (VPSV)
Daily profiles or Volume Profile Session Volume (VPSV) shows the volume profile for all sessions shown on a chart. In the graphic, you can observe a segmented volume profile for each session. Each session is treated as a day, and the same is true when the chart’s period is changed.
Fintatech Paper Trading
Trade, like any other endeavor, needs ongoing practice and refinement. Fintatech Paper Trading’s connection to the platform is one of the newest modifications as a result. Simply said, you don’t need to connect to a broker, establish accounts, or spend money studying and experimenting with new ideas. Fintatech Paper Trading is a type of trading that involves the use of a virtual balance.
Advantages of paper trading include:
- The ability for newcomers to learn how to trade without risking their money. A rookie investor will learn to approach the actual market with experience and confidence using Fintatech Paper Trading, integrating their theoretical understanding with practical expertise.
- Traders with a lot of experience may put their trading ideas to the test. Fintatech Paper Trading’s benefits are best described by the phrase “score twice before you cut once”, since it allows you to attempt even the most daring ideas without risking your money or your sanity.
- Paper trading is also a risk-free approach to experiment with new trading strategies. A long-term investor, for example, may try day trading, and vice versa.
- Traders will have the opportunity to practice and develop their trading abilities regularly.
Testing your approaches, learning to trade, practicing your abilities, and applying theoretical information has never been easier or less risky. All decisions and trading manipulations must satisfy the market’s needs and actual trading goals in order for all of this to be as productive and lucrative as feasible for the trader. The same risk and return targets, investment limits, and trading horizon must be calculated for the paper investor as well as for the actual account. This is how you can learn and improve your results with Fintatech Paper Trading.
Fundamental data view widget
The efficiency and need for fundamental analysis are hotly debated. Basic information on the company and its present market position, on the other hand, is important for all sorts of analyses. It will undoubtedly be useful while making critical decisions.
That’s why we’ve incorporated a widget into our platform that displays fundamental data. From now on, you can get all the information you need, from a brief overview of the company’s operations to its market capitalization in one place and with just one click.
Overall speed improvements
Continuous improvement and the discovery of new ways to improve our product, as previously said, is an important aspect of our work. And the majority of this work is done behind the scenes in the programming of the code. However, as a result, we now have faster charting, fewer gaps, and an overall more user-friendly product.
Subscribe to our email newsletter to receive the latest news, cases, and announcements from Fintatech.

Twitter
Linkedin
Facebook