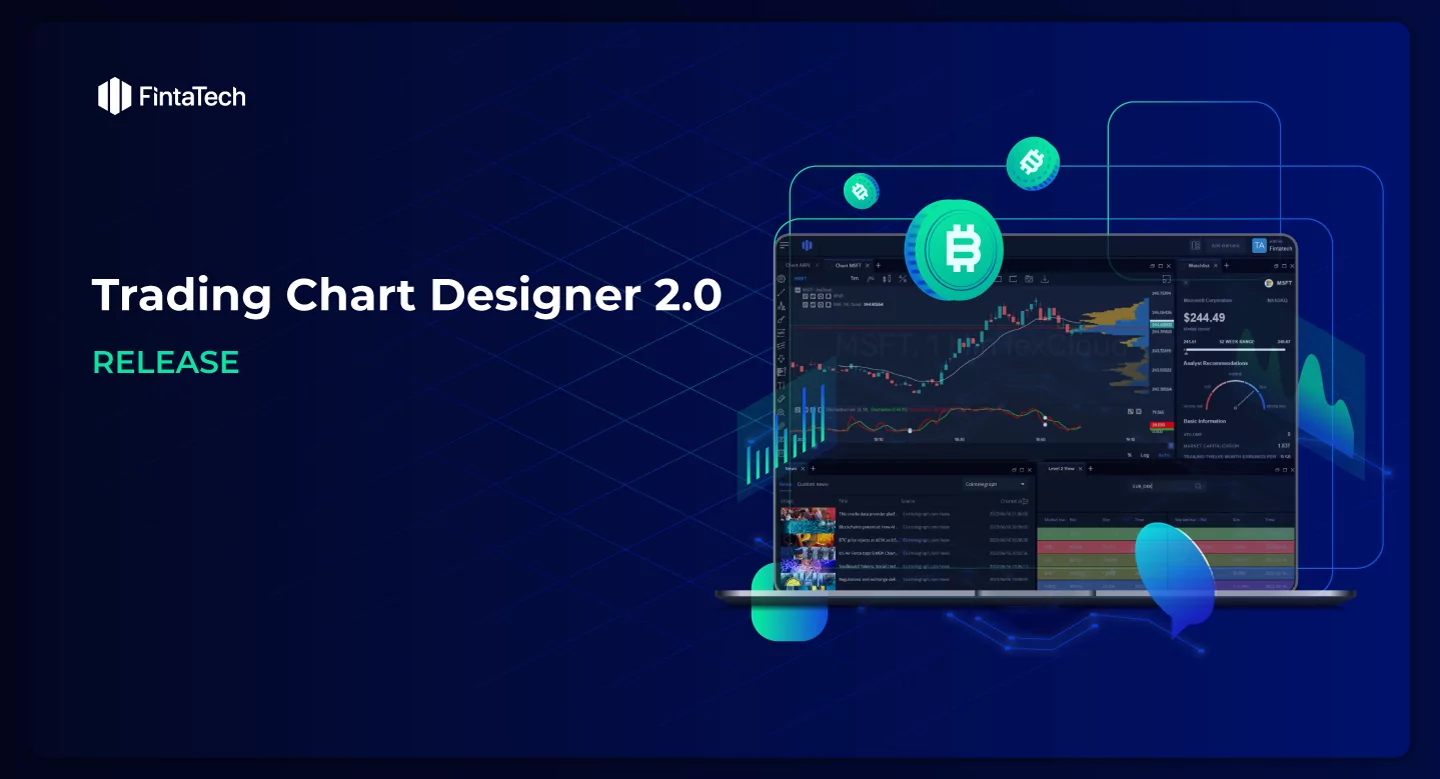
At Fintatech, we dedicate ourselves to improving our software to meet the ever-evolving needs of traders. We know how important it is to have a good platform to make sure our users succeed. That’s why we’re excited to tell you about the new version of Trading Chart Designer 2.1, which has lots of cool new things added to it.
Our latest release was designed to provide an even faster, more productive, and more functional solution. It will enhance your trading experience. We have made many changes and implemented advanced technologies to optimize the performance of our software.
In this article, we will explore some of the key enhancements you can expect from Trading Chart Designer 2.1, including:
- Chart popup with order and execution lines
- Asset change by typing in the chart
- Timeframe change by typing in the chart
- Trading session support
- VWAP indicator
- Drawing tools menu improvements
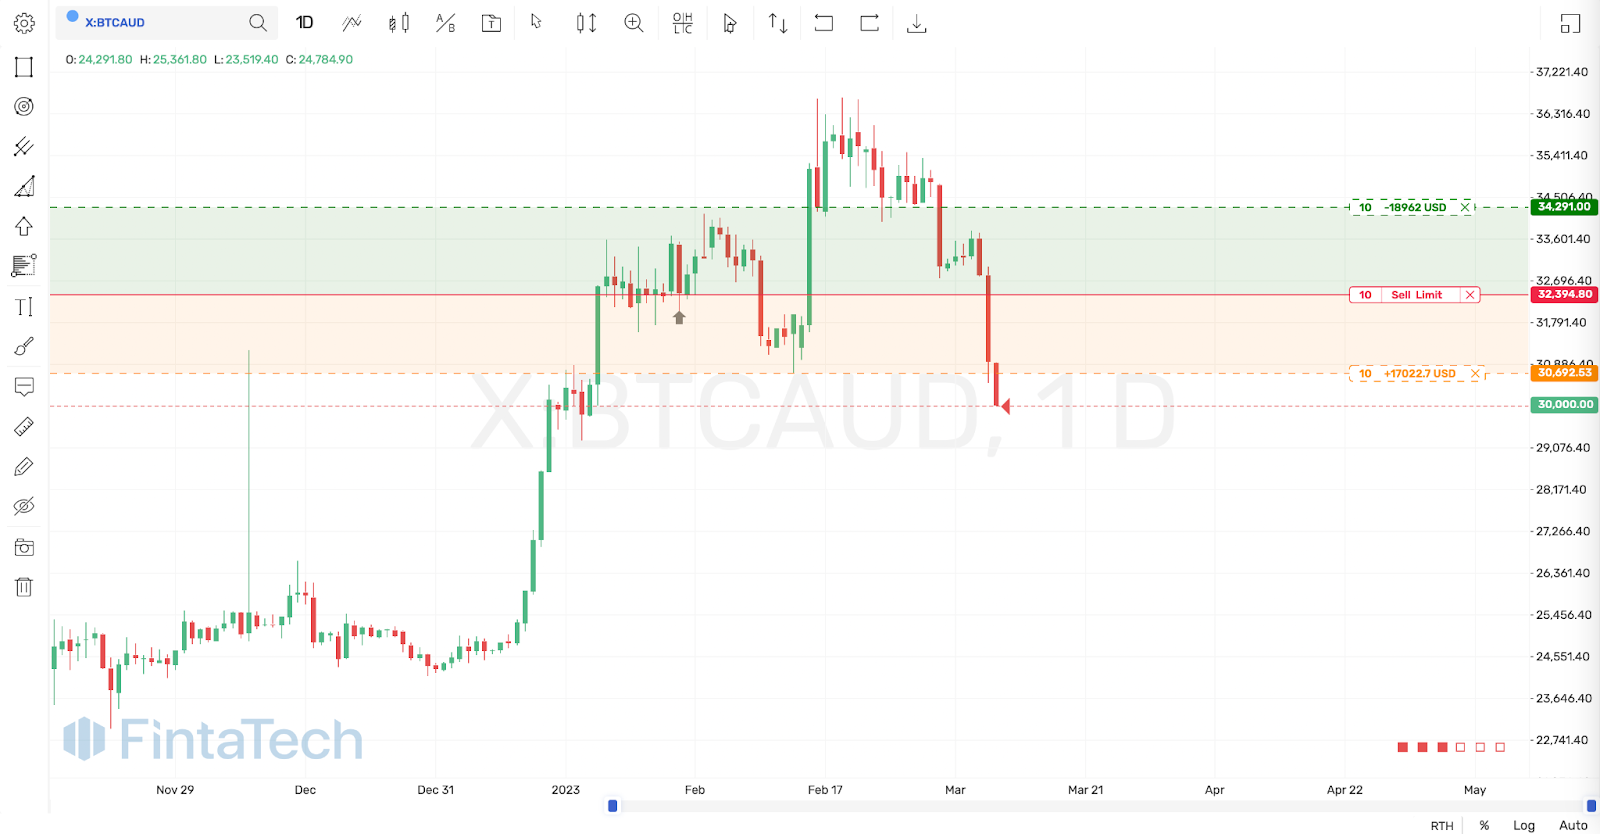
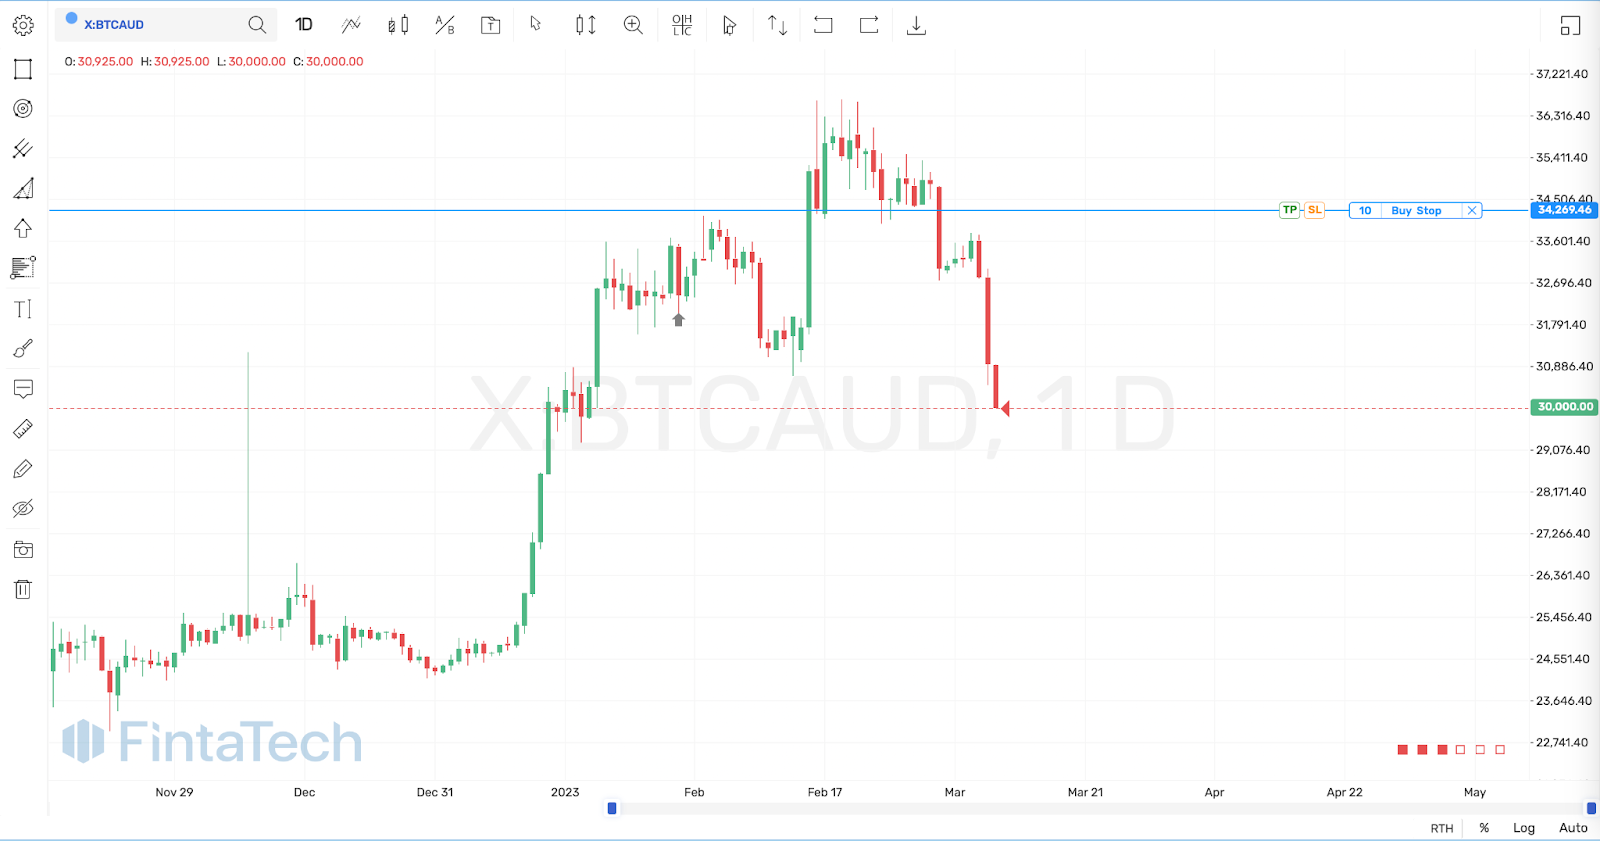
Chart popup with orders and execution lines
The latest software update features a new functionality of a right-click chart popup with support for orders, executions, stop-loss (STP), and take-profit (TP) lines. It enables users to access a context menu by right-clicking on the chart. The context menu offers a comprehensive range of functions that can assist traders in making informed decisions about their trades. These functions include creating orders, executions, stop-loss, and take-profit lines. Additionally, the software has introduced new drawings that represent these functions, enhancing their usability and improving user experience.
The latest update also has an API that lets developers customize the context menu to match their trading strategies and preferences. To help developers have more control over their charting software, they can personalize it according to their needs. With this update, the web charting software’s functionality has improved, allowing users to make better trading decisions.
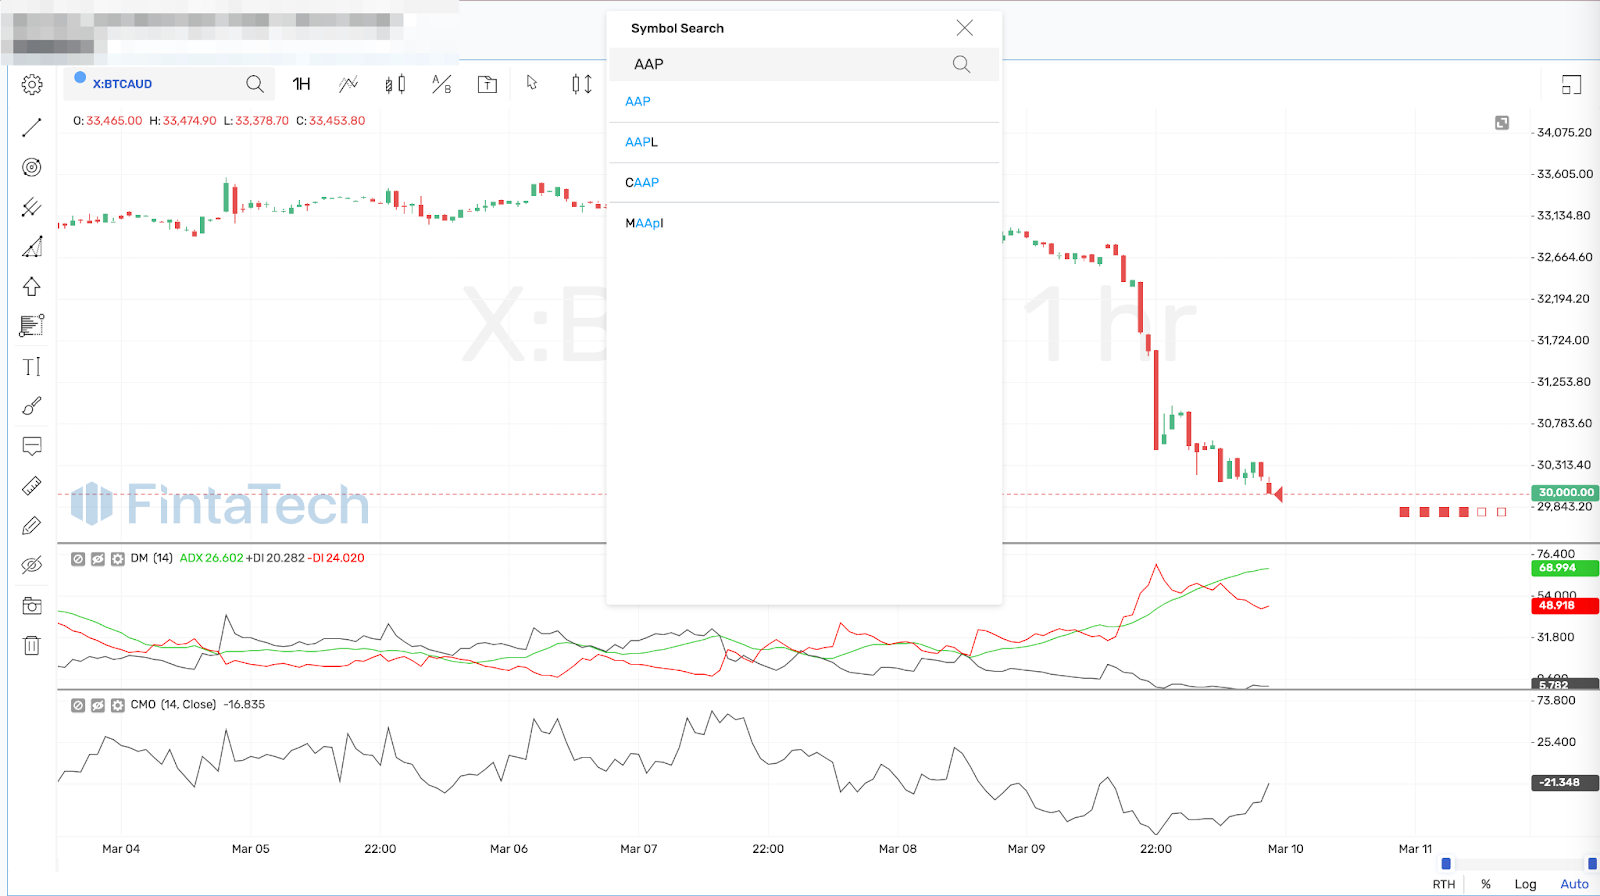
Asset change by typing in the chart
This feature enables traders to change the asset being viewed on the chart by simply typing the asset name directly into their keyboard. Such technology makes it easy to switch between assets. There’s no need to navigate through multiple menus or click on various buttons. It’s a quick and efficient way to change assets. This feature makes it easier for traders to switch between assets, helping them to make decisions more quickly. Traders can focus on the assets they want to look at without spending time navigating or searching. This addition shows that the financial charting software is designed with users in mind. Also, it is always looking for ways to improve its usability and features.
Timeframe change by typing in the chart
The possibility to change the timeframe when typing in the chart is a brilliant addition. It allows traders to modify the trading chart’s timeframe by typing in a numeric value followed by the Enter key. This feature facilitates a quick and efficient way to analyze market trends and price movements. Thus, the user can easily adjust the timeframe. It enhances their ability to make informed trading decisions. It also helps optimize their trading strategies.
Trading Session Support
The Trading Session Support feature is new. It allows traders to switch between two chart data views. They are the main full session and a reduced session that shows data only between session hours. It is helpful because it provides insights into price movements that occur during after-hours trading. So traders can analyze market data more effectively and make better-informed trading decisions. With this feature, traders can gain a more complete view of the market and make more accurate and profitable trades.
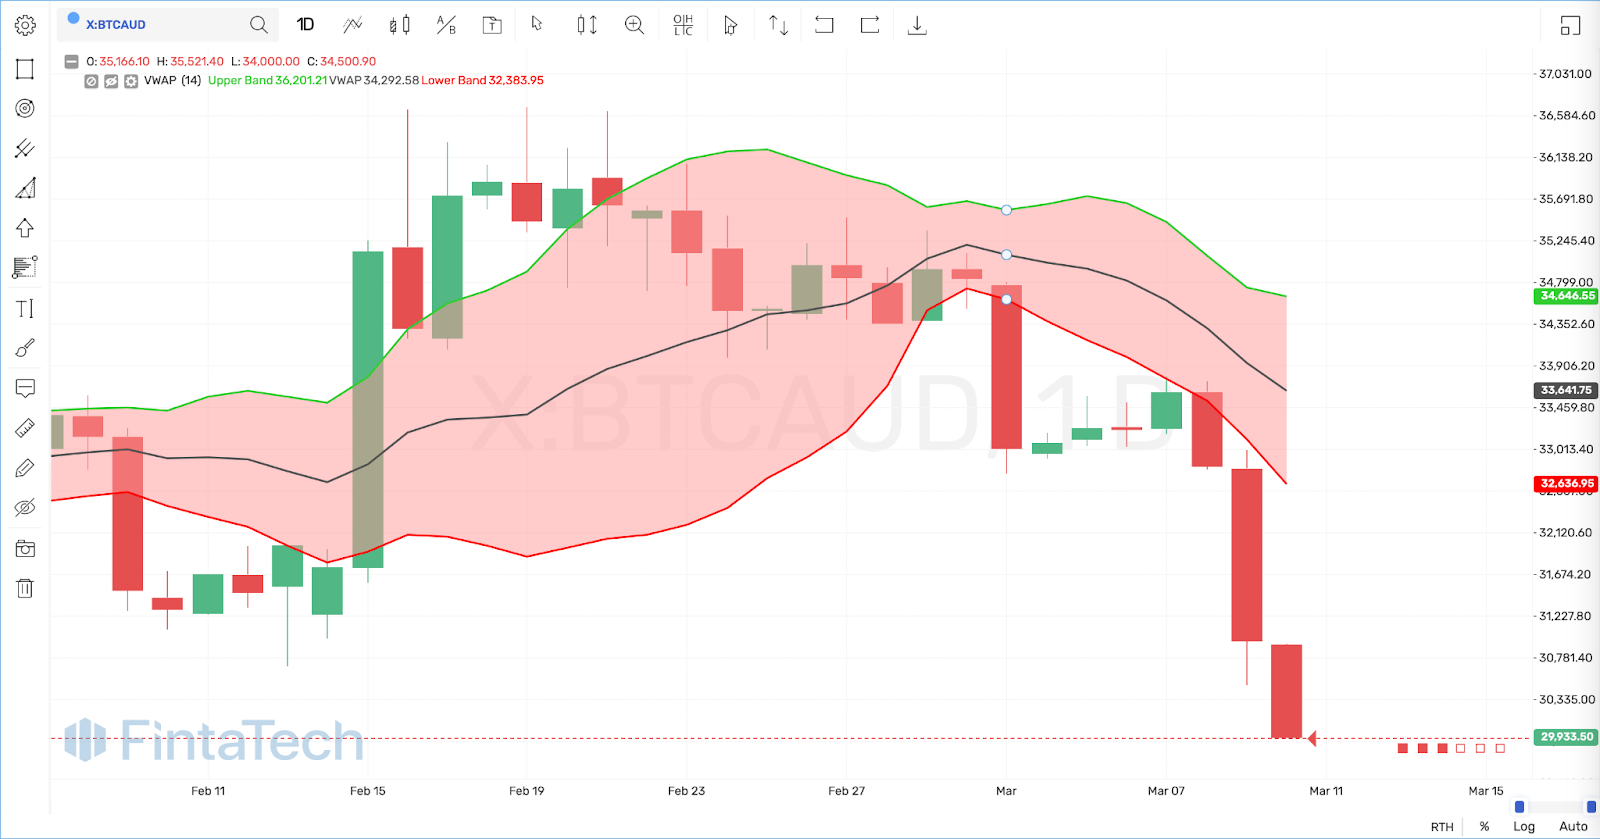
VWAP Indicator
Volume Weighted Average Price (VWAP) is a technical analysis tool used to measure the average price weighted by volume. VWAP is frequently used with intraday charts to identify market trends, as it is comparable to a moving average. The VWAP indicator provides technical analysts. It has a more comprehensive understanding of market trends. With the inclusion of the VWAP indicator in the charting software enhances its functionality and usefulness for traders.
Drawing Tools Menu Improvements
Our team has improved the menu’s user interface. We made it more intuitive and easier to use, with a streamlined and more organized layout.
These updates offer several benefits to traders. They can now use advanced technical analysis tools to spot patterns, trends, and support/resistance levels. The added features will assist traders in developing more efficient trading strategies. As a result, users get better performance and more profitable trades.
Subscribe to our email newsletter to receive the latest news, cases, and announcements from Fintatech.


Twitter
Linkedin
Facebook