Trading Chart Designer

Powerful Financial HTML5 Chart Library with Technical Analysis and Trading Capabilities. Easy to Integrate and Customize

Supported asset classes: Crypto, FX, Stocks, Options, Futures, Spread Bets

The Shortest Time-to-Market Charting Solution for Integrating with Your Stack

End-User Ready

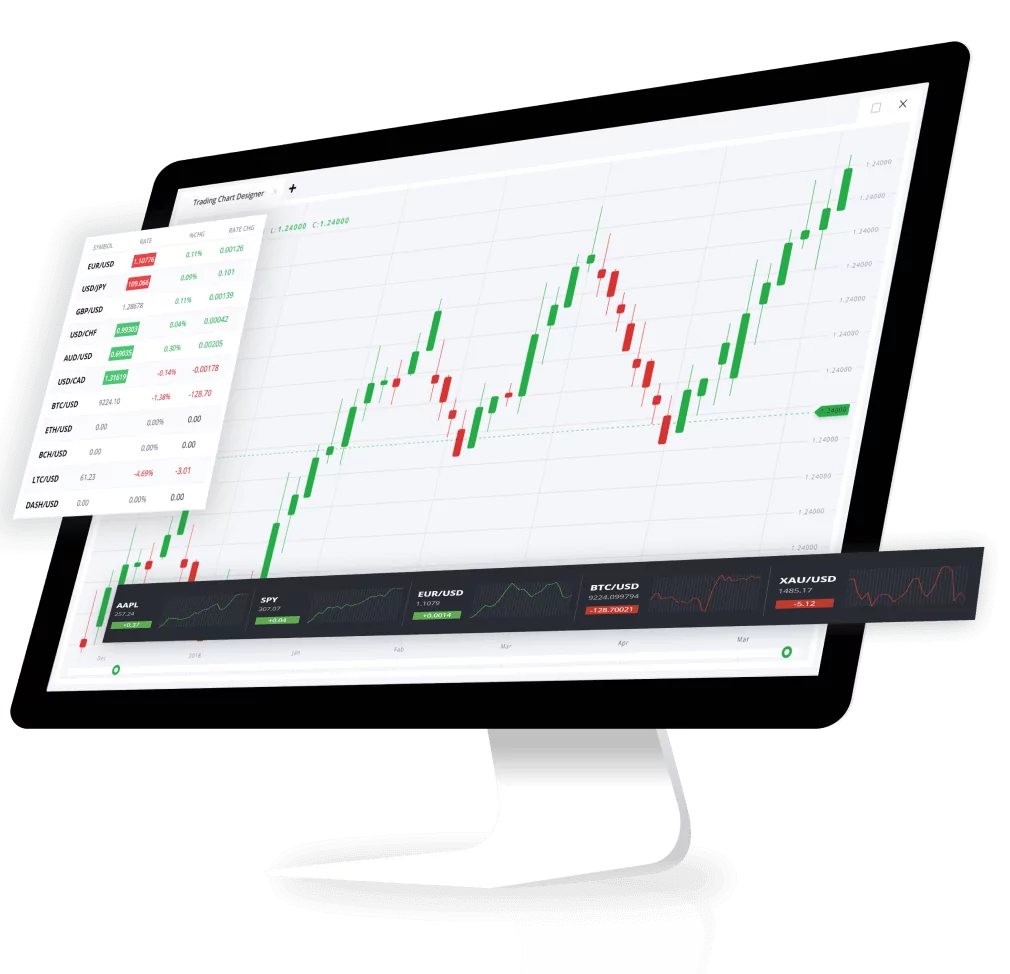
Ready-to-use financial chart with little to no developer involvement required. Integration and end-user delivery takes hours, not months.

Developer-Friendly

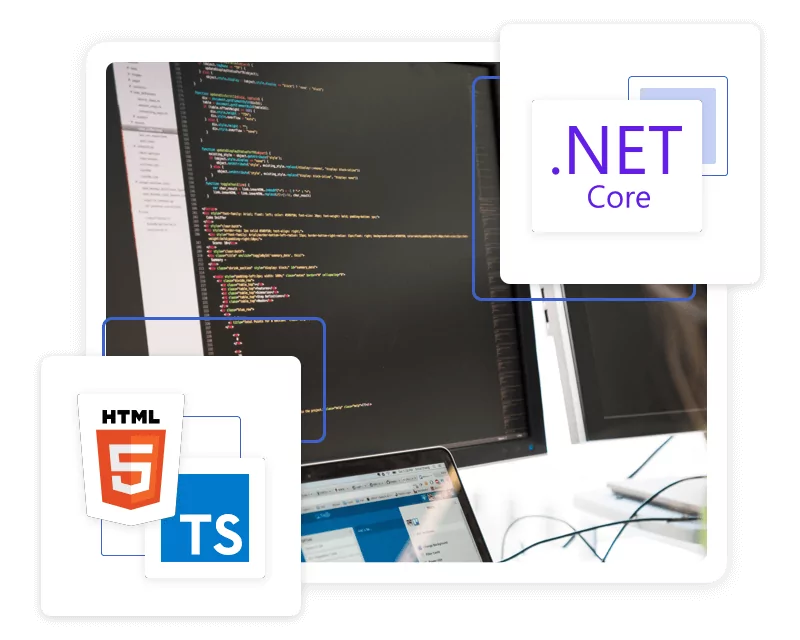
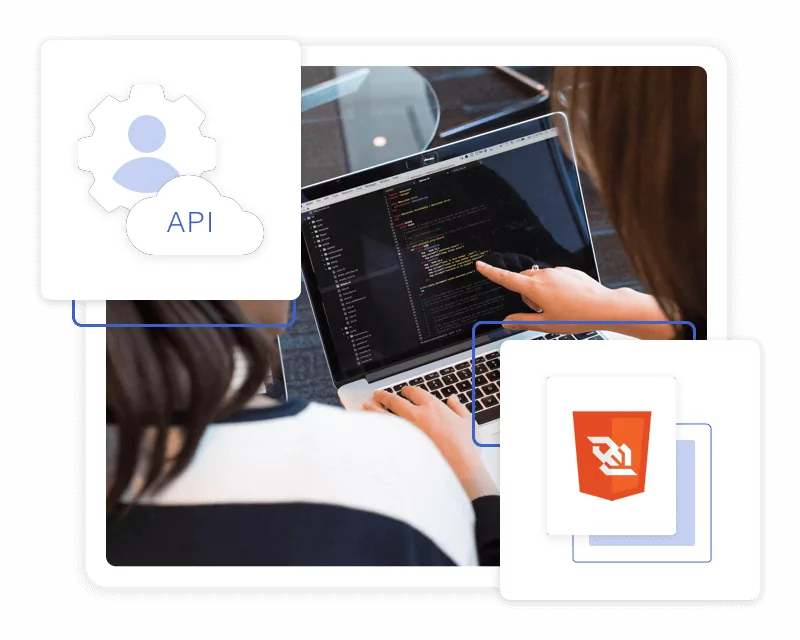
Fintatech’s HTML5 trading chart library has comprehensive documentation and minimalistic powerful API built by developers, for developers.

Any Platform, Device, or Stack

The HTML5 charting component works flawlessly with any back-end database or server stack and renders crisp and clear on any browser and OS.

Mobile and Touch Optimized

The solution’s drag and drop interface is not only responsive, but supports multi-touch gestures for seamless mobile UX.

1,800,000-Bar Powerful

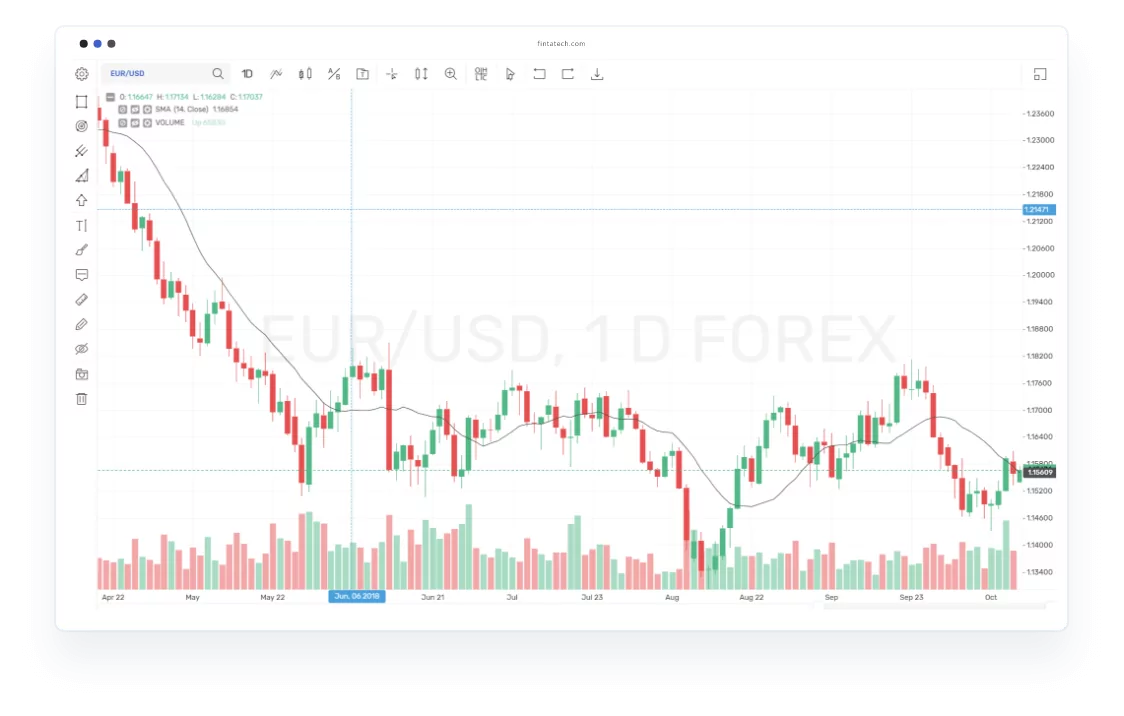
Lightweight yet powerful, Fintatech’s trading chart is capable of consuming and rendering 1,800,000 bars or more than 5 years of market data.

Flexible Styling & Branding

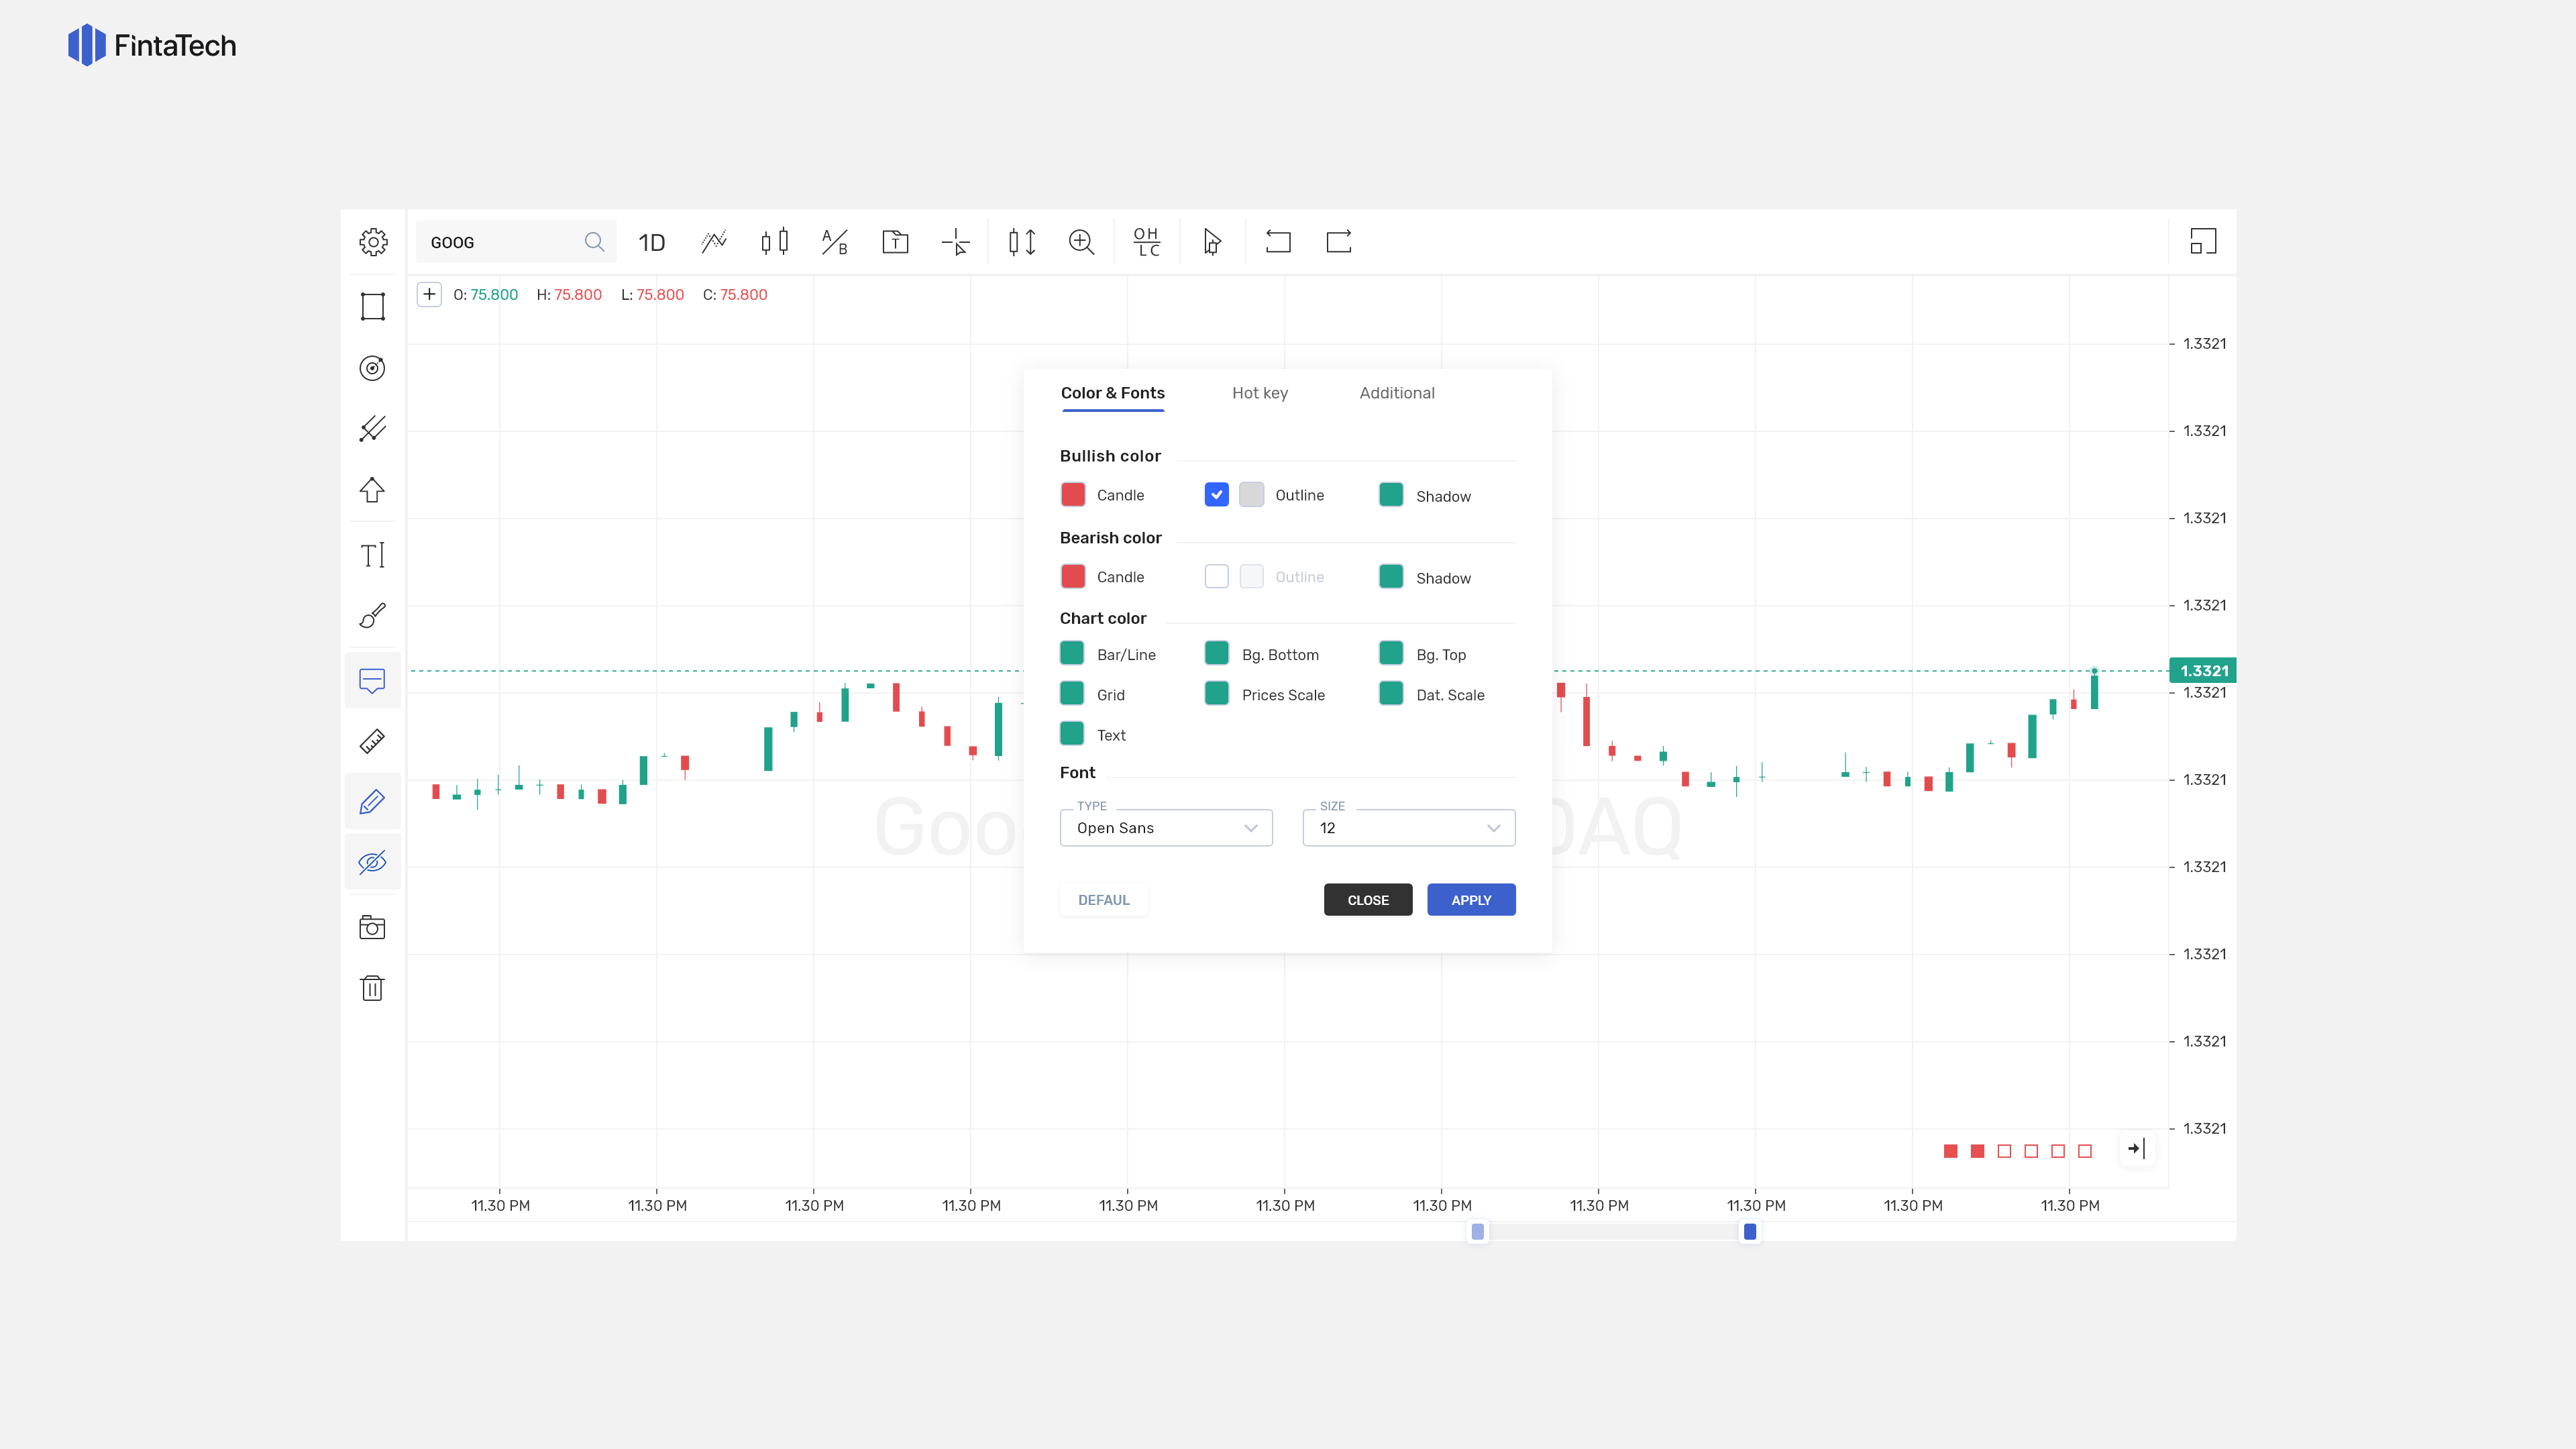
The chart’s look and feel will perfectly match your style and branding with color themes, custom chart colors, fonts, custom logos, etc.

Single license for Two Products

Use our amazing HTML5 chart standalone trading frontend, or a chart with trading capabilities. Simply turn trading features on and off through the API.

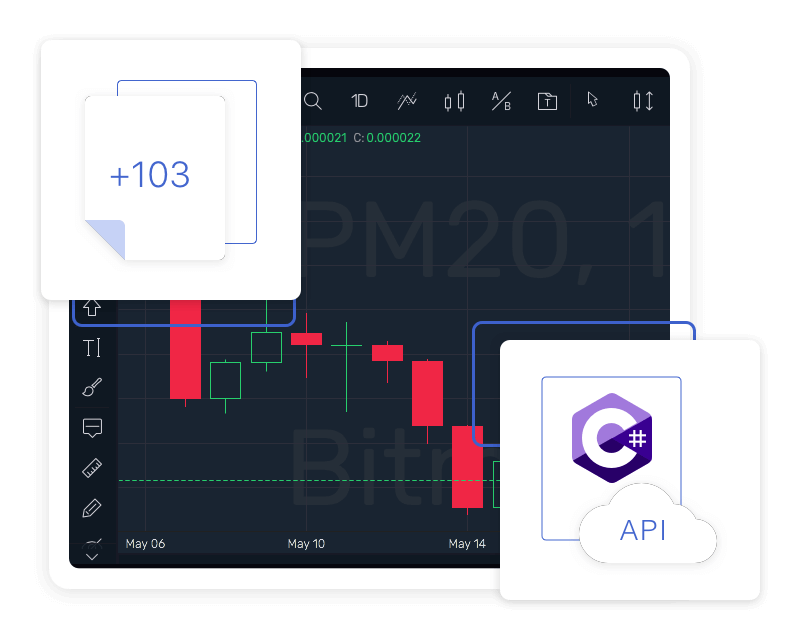
Powerful technical analysis solution loaded with high-end features, 15 chart types, 103 tech indicators, and other advanced tools.

Image

Charting solution for visual trading with portfolio monitoring, point & click order adjustments, and watchlist. Full-fledged tech analysis included.

Image

Built with modern technologies

Financial Chart’s TA Toolset in Numbers

103 Technical Indicators

AD Index, ADL, ADXR, APZ, Aroon, Aroon Oscilator, ASI, ATR, Bollinger, BOP, CCI, Center Of Gravity, CFO, Chankin Money Flow, Chaikin Oscillator, .. Chaikin Volatility, CMO, CoppockCurve, CRC, DBox, DEMA, Deviation To MA, DM, Donchian Channel, Easy Of Movement, EFI, EFT, Elder Ray, Elder Thermometer, EMA, FOSC, GRI, High Low Bands, Historical Volatility, HMA,HML, Ichimoku, IMI, Kama, Kelther Chanel, Key Reversal Down, Key Reversal Up, Linear Regression, Linear Regression Forecast, Linear Regression Intercept, Linear Regression Slope, Log Change, MACD, Ma Envelopes, Market Facilititation Index, MAX, Mc Ginleys Dynamic, Median Price, MFI, MIN, Momentum, NBars Down, NBars Up, NVI, OBV, Performance Index, PFE, PGO, Price Oscillator, PVI, PVT, Range, RAVI, RIND, ROC, RSI, RSS, SMA, StdDev, Stochastics, Stochastics Fast, Stoch RSI, SUM, Swing Index, TEMA, TMA, TMF, TRIX, True Range, TSF, TSI, TVI, Typical Price, Ultimate Oscillator, VIDYA, VMA, VOLUME, VOLMA, Volume Oscillator, Volume UP Down, VROK, VWAP, WAD, Weighted Close, Williams %R, WMA, WWS, ZLEMA.

15 Chart Types

Classic Bar, Colored Classic Bar, Range Bar, Candle Stick, Hollow Candles, Heikin Ashi, Renko, Line Break, Kagi, Candle Volume, Equi Volume, Equi Volume Shadow, Single Line, Mountain, Point Figure

9 Graphical Analysis Tools

Lines, Rectangular, Triangle, Circle, Ellipse, Polygon, Polyline, Cyclic Lines, Free Hand Drawing

9 Trend Analysis Tools

Trend Channel, Andrew’s Pitchfork, Error Channel, Raff Regression, Quadrant Lines, Tirone Levels, Gann Fan, Trend Ange, Speed Lines

8 Pattern Analysis Tools

Kings Crown, Head and Shoulders, ABCD Pattern, XABCD Pattern, Triangle Pattern, Elliott Wave Pattern, Number Labels, ABCD Labels

6 Fibonacci Analysis Tools

Fibonacci Arcs, Fibonacci Ellipses, Fibonacci Retracement, Fibonacci Fan, Fibonacci Time Zones, Fibonacci Extension

Drag and Drop Multi-Chart Experience

Fintatech’s adjustable web trading chart supports one screen to a dozen on any operating system and browser for the best end-user UX imaginable; up to 8 component windows on one monitor.

Dish

Display data on multiple screens

Dish

Compare the market across multiple timeframes

Dish

Control charting widows layout via drag and drop

Dish

Switch between light and dark themes

1,800,000 bars of historical data or 5 years of market data

In a single lightweight HTML5 Canvas + TypeScript charting component

Core Features

Built-in Trading Capability

Fintatech’s equity trading platform is ready for integration with any custom broker or data feed via API right out of the box. The start of data consumption is just a matter of a few development hours.

Any Data Source or Type

Connect any custom broker endpoint through an API or custom data feed be it live or historical. Trading chart costumes any data type be it stock, foriegn exchange, futures, or cryptocurrency.

Easy Brand White Labeling

Rebrand the charting component in minutes by easily tweaking one of 8 color schemes, editing layout, and adding your logo. Order more customization options from Fintatech team.

Custom Indicators

Let your clients supplement 103+ built-in technical indicators with easy-programmable custom indicators via minimalistic API using FintaScript or C#.

Minimalistic API

Enjoy using a Fully-fledged API (REST, Web Socket) for custom indicators, object creation and integration with any financial data feed. All documentation is provided.

End-User Annotations

The chart supports placing custom labels on the chart to display news or events right next to prices. Let analysts and end-users to apply statistical calculations on any data-set without the aid of developers.

We’re Here for a Long-Time Partnership

One Year of Support Included
We provide a year of limited technical support and assistanceto every client who got their project delivered by Fintatech.
Regular Product Updates
We’ll be delivering regular product updates once a quarter for 1 year after the purchase for all delivered TPSs that aren’t heavily customized.

Let’s Talk Business

Tell us about the business and technology challenges you face, and our
expert team will advise you on the solutions. Easy as that!

    We usually reply within one business day.

    Arrow-up
  • Twitter

  • Linkedin

  • Facebook