Navigating the financial markets can often feel like trying to predict the weather — complex, fast-changing, and influenced by countless variables. Whether you’re trading stocks, forex, crypto, or commodities, one of the most reliable ways to make sense of market movements is through the use of market indicators.
Market indicators are essential tools used by traders and investors to analyze past and present price action, identify trends, and forecast potential future movements. These indicators, derived from historical data such as price, volume, and volatility, form the backbone of technical analysis, a method that relies on chart patterns and statistical measures rather than company fundamentals or macroeconomic data.
For both beginners and seasoned traders, understanding how to use market indicators can significantly improve the ability to enter and exit trades more effectively. However, with so many types available and varying opinions on which ones are most reliable, it’s important to learn what each indicator does, how it functions, and when to use it.
What Are Market Indicators?
Market indicators are tools traders and investors use to assess the overall state of the market and support strategic decisions. These indicators analyze market-generated data such as price movements, trading volume, volatility levels, and sentiment to offer a broader view of what’s really happening beneath the surface.
Unlike fundamental analysis, which focuses on earnings reports, economic indicators, or company health, market indicators focus solely on market behavior itself. They help cut through news noise and emotional bias by translating raw data into usable signals.
Market indicators can answer questions like:
- Is the market gaining strength or losing momentum?
- Are most stocks participating in a rally, or is leadership narrow?
- Is current price action supported by volume
- Are fear or greed dominating investor behavior?
Used correctly, they help traders:
- Spot potential trend reversals
- Confirm the strength of ongoing trends
- Time entries and exits more effectively
- Adjust risk exposure based on market conditions
Some indicators are reactive (lagging), others are anticipatory (leading), and each has strengths depending on the trading environment. Whether you’re day trading or managing long-term positions, market indicators are contextual tools that provide clarity in a fast-moving world but they should always be used alongside discipline, strategy, and risk management.
How Do Market Indicators Work?
To understand how market indicators function, imagine them as filters that convert noisy, real-time market data into structured, actionable insights. They do this through a mix of mathematical formulas, statistical analysis, and pattern recognition.
Here’s how the process works:
1. Input: Raw Market Data
Indicators are powered by key market inputs:
- Price: Open, high, low, close
- Volume: How many shares/contracts are traded
- Volatility: Range and speed of price movement
- Macro data: Yields, sentiment indexes, currency strength
2. Mathematical Processing
Each indicator applies a specific formula:
- Moving averages smooth price data to show trends
- RSI and Stochastic Oscillator measure momentum
- Bollinger Bands use standard deviation to track volatility
- Put/Call ratios or breadth indicators gauge sentiment or participation
This mathematical transformation distills chaotic data into a structured format traders can easily interpret.
3. Signal Generation & Interpretation
Indicators generate signals in various forms:
- A line crossing above a moving average (trend signal)
- An oscillator rising above a threshold (momentum shift)
- A volume spike confirming a breakout
- Divergence between price and an indicator suggesting a possible reversal
Experienced traders combine these signals and interpret them based on market context, looking for confluence when several indicators align to reinforce a high-probability trade setup.
4. Application in Strategy & Risk
Market indicators help not only with timing entries and exits, but also with:
- Setting stop-loss levels (e.g., via ATR)
- Measuring volatility and adjusting position size
- Confirming whether a breakout is genuine or weak
In short, indicators work by taking raw data and turning it into patterns you can trade with logic not emotion. Used together, they form the technical foundation of smart decision-making in today’s complex markets.
Types of Market Indicators
Not all market moves are created equal and neither are the tools used to analyze them. While price action is the most visible part of the market, experienced traders know that real insight comes from reading what’s happening beneath the surface. That’s where market indicators come in.
These indicators act like a diagnostic dashboard, offering deeper visibility into the market’s internal dynamics: whether a rally is supported by broad participation, how investors are feeling, how much risk is priced in, and whether the macro backdrop is helping or hurting momentum. By grouping them into key categories, traders can more easily track what matters most and respond with greater confidence.
Below are the five essential types of market indicators, each answering a different strategic question and offering a unique perspective on market behavior.
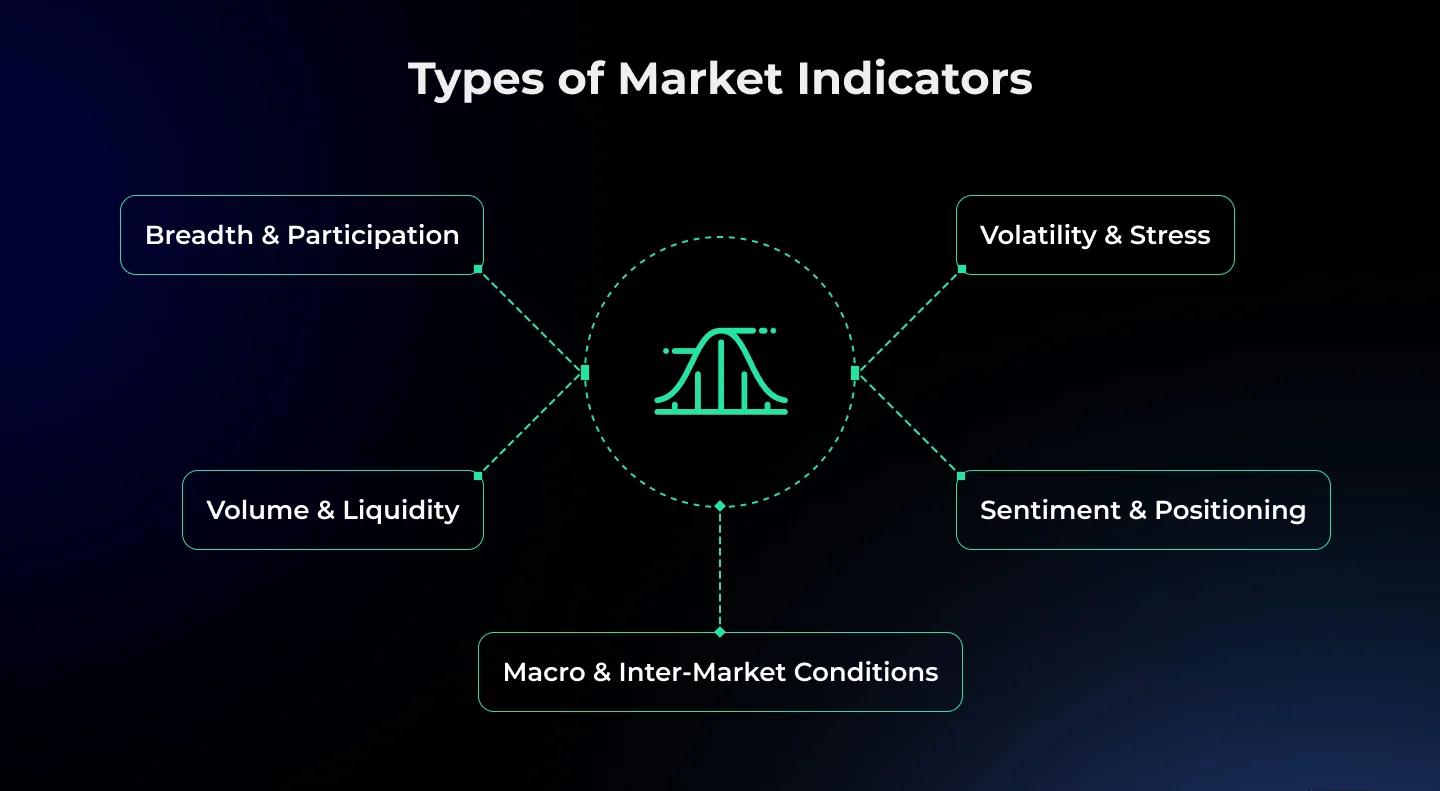
1. Breadth & Participation
Breadth indicators measure how widespread a move is across the market. A rally driven by just a handful of large-cap stocks can give a false sense of strength, while a broad-based rally where most stocks participate signals healthier market momentum.
Expanded examples:
- Advance/Decline Line (A/D Line): Tracks the net difference between advancing and declining stocks. A rising A/D line confirms bullish strength. A divergence where the index makes new highs but the A/D line does not can warn of a weakening trend.
- Percentage of Stocks Above Moving Averages: Tracks what portion of the index constituents are trading above key moving averages (like the 50-day or 200-day). High percentages during an uptrend show strong support. Sharp drops may signal a potential breakdown.
- New Highs vs. New Lows: Measures how many stocks are hitting new 52-week highs compared to those hitting new lows. Expanding highs reflect leadership. If new lows increase while the market holds steady, it suggests internal weakness.
Why it matters: Breadth tells you whether the market’s foundation is solid or hollow. Strong participation = strength; weak participation = fragility.
Pro tip: Use breadth to confirm trend breakouts or breakdowns — especially when trading indices or ETFs.
2. Volatility & Stress
Volatility indicators measure the market’s emotional temperature. They show whether investors are becoming nervous (buying protection) or relaxed (selling volatility). These are often contrarian indicators, meaning extreme levels may hint at turning points.
Expanded examples:
- VIX (Volatility Index): Reflects expected 30-day volatility in the S&P 500. A rising VIX indicates fear or uncertainty. A falling VIX suggests complacency. Spikes often occur during corrections or crashes and can signal climactic fear.
- VVIX: The volatility of the VIX itself. Surges in the VVIX often precede major VIX spikes, acting as an early warning system for stress events.
- MOVE Index: Think of it as the “VIX for bonds.” Rising MOVE values suggest increasing interest rate uncertainty, which often leads to equity volatility.
Why it matters: Elevated volatility often signals risk aversion, while suppressed volatility can set the stage for explosive moves.
Pro tip: Watch for VIX divergences — if volatility rises while prices rise, it could signal internal market stress.
3. Volume & Liquidity
Volume shows the strength and conviction behind price action. Without sufficient volume, price movements may lack follow-through. High volume during a breakout adds validity; low volume can signal a false move or lack of investor interest.
Expanded examples:
- NYSE Up/Down Volume: Compares the total volume of advancing vs. declining stocks. Positive volume breadth supports a rally. Negative volume breadth, even in a rising market, can be a warning sign.
- Total Exchange Volume: Spikes in volume often occur at turning points or during high-conviction moves. Compare against a 20-day or 50-day average to assess significance.
- Index-level OBV (On-Balance Volume): A cumulative indicator that adds volume on up days and subtracts it on down days. Rising OBV alongside price = strong confirmation. Divergence between OBV and price = caution.
Why it matters: Volume is the fuel behind price. Without it, even the strongest-looking rally can stall.
Pro tip: Volume indicators are especially powerful when used to validate breakouts, breakdowns, or reversal patterns like head and shoulders.
4. Sentiment & Positioning
Sentiment indicators capture trader psychology. When too many market participants are leaning the same way, the market often does the opposite. This is why these indicators are typically used contrarian-style — extreme optimism = risk of a pullback, extreme fear = opportunity.
Expanded examples:
- Put/Call Ratio: Measures the ratio of bearish (put) options to bullish (call) options. A very low ratio can suggest complacency and overconfidence; a high ratio can indicate fear and potential rebound conditions.
- AAII Bull-Bear Sentiment Survey: Weekly poll of retail investors. When bullish readings hit extremes (e.g., >50%), it’s often followed by market weakness. High bearish readings can signal capitulation.
- COT Report (Commitment of Traders): Published by the CFTC, this report reveals how large institutional traders are positioned across futures markets. Sharp imbalances can signal crowded trades.
Why it matters: Sentiment extremes often act as contrarian indicators. Crowds tend to be most wrong at turning points.
Pro tip: Use sentiment in combination with price action—wait for the market to start reversing after an extreme before acting.
5. Macro & Inter-Market Conditions
These indicators track inter-market relationships and macroeconomic trends that influence the market’s backdrop. They help you understand whether the environment supports risk-taking or demands caution.
Expanded examples:
- Yield Curve (10-year minus 2-year spread): When short-term rates exceed long-term rates (curve inversion), it signals recession risk. Equities tend to struggle in this phase of the cycle.
- DXY (U.S. Dollar Index): A strong dollar often hurts multinational earnings, suppresses commodity prices, and tightens global liquidity. A falling dollar is usually bullish for stocks and commodities.
- High-Yield vs. Treasury Spreads: Measures the risk premium investors demand for lending to riskier companies. Widening spreads suggest rising credit risk, which can lead to equity market stress.
Why it matters: Even the best setups fail when macro tides shift against risk. Use macro indicators as a filter for trade quality.
Pro tip: Combine macro readings with technical setups. A bullish chart is much more powerful in a favorable macro environment.
By understanding and combining these five types of market indicators you gain a deeper, multi-dimensional view of the market. No single indicator tells the full story, but together, they help you filter noise, validate trends, and make more informed, confident trading decisions.
Practical Ways to Use Market Indicators
Understanding what market indicators measure is only half the battle knowing how to use them effectively is what separates casual observation from confident, informed decision-making. Whether you’re a swing trader, day trader, or long-term investor, the key to using market indicators is not in isolation, but in context, combination, and confirmation.
Below are several practical ways to put market indicators to work in your trading strategy:
1. Confirm the Strength Behind Price Moves
A chart may show a clean breakout or breakdown, but without confirmation from volume or breadth indicators, it could be a trap.
How to apply this:
- Use volume (e.g., Up/Down Volume or OBV) to confirm buying or selling pressure. If a breakout occurs on low volume, it lacks conviction.
- Check breadth indicators like the Advance/Decline Line. If the market is rising but most stocks are falling, it suggests weak internal support.
- Look at new highs vs. new lows — a narrowing leadership base can warn of exhaustion even when indexes look strong.
2. Time Your Entries Using Momentum Tools
Momentum indicators help traders pinpoint when to enter or avoid a trade by highlighting shifts in buying/selling strength.
How to apply this:
- Use RSI (Relative Strength Index) to spot overbought or oversold conditions. In strong trends, RSI pullbacks to 40–50 often present low-risk entry points.
- MACD crossovers after consolidations or corrections signal potential trend resumptions.
- Spot divergences between price and momentum (e.g., price makes higher highs, RSI makes lower highs) as early reversal warnings.
3. Evaluate Market Conditions Before Entering a Trade
Even if your setup looks great, a hostile market environment can drastically reduce its success rate. This is where volatility and macro indicators come in.
How to apply this:
- If the VIX is rising sharply or above historical norms, it signals elevated fear—be more cautious or reduce trade size.
- A rising MOVE Index (bond volatility) can signal macroeconomic instability that may soon spill into equities.
- Watch credit spreads widening spreads between high-yield and Treasury bonds indicate that risk appetite is deteriorating.
4. Use Sentiment Indicators to Anticipate Turning Points
Sentiment indicators measure how bullish or bearish market participants are. They’re most effective at extremes, where the crowd is often wrong.
How to apply this:
- When the Put/Call Ratio drops too low, it signals excessive optimism often right before a pullback.
- The AAII Sentiment Survey can flag when retail investors are overly bullish or fearful. Extreme bullishness is often a late-cycle sign.
- Use COT (Commitment of Traders) data to see when large speculators are all on one side of the trade this can create opportunities in the opposite direction.
5. Build a Custom Indicator Dashboard
Rather than relying on a single indicator, professional traders monitor a combination of metrics that give a complete view of market health. You can do the same by building a custom dashboard that reflects your trading goals and timeframe.
Sample dashboard structure:
- Trend: 50- or 200-day Moving Average, ADX
- Breadth: Advance/Decline Line, % of stocks above 50-day MA
- Volume: OBV, Volume Oscillator
- Volatility: VIX, ATR (for stop placement)
- Sentiment: Put/Call Ratio, AAII Survey
- Macro: Yield Curve (10Y–2Y), DXY, Credit Spreads
Review your dashboard daily or weekly depending on your trading style. When most indicators align, confidence increases. When they conflict, it may be time to wait, reduce exposure, or hedge.
6. Use Indicators for Risk Management, Not Just Entries
One of the most overlooked uses of market indicators is their ability to guide position sizing, stop placement, and trade exit timing.
How to apply this:
- Use ATR (Average True Range) to set dynamic stop-loss levels that adjust to volatility.
- Use volume spikes as potential exit signals especially during parabolic moves or euphoric price surges.
- Use macro or sentiment shifts (e.g., sudden VIX spike, aggressive retail positioning) as signals to reduce size or take partial profits.
Remember: Indicators are not just for getting in they’re essential tools for protecting capital and managing trades once you’re in them.
Final Thought
In today’s fast-moving markets, reacting to headlines or raw price action alone simply isn’t enough. To trade with clarity and confidence, you need tools that go deeper tools that help you understand not just what the market is doing, but why. That’s exactly what market indicators provide.
By using a structured mix of indicators trend, volume, breadth, sentiment, volatility, and macro you gain a layered understanding of the forces shaping price movement. These tools reveal the conviction behind a breakout, the weakness behind a rally, or the hidden stress before a sudden reversal. They don’t predict the future, but they help you see the probabilities more clearly.
Here’s what separates skilled traders and investors from the rest:
- They don’t rely on a single indicator: they build confluence from multiple sources.
- They don’t chase every move: they use indicators to filter noise and focus on high-quality setups.
- They don’t just use indicators for entries: they apply them to manage risk, time exits, and size positions effectively.
Whether you’re day trading in a fast market or managing a long-term portfolio, market indicators act as your compass. When used with discipline and within a broader strategy, they turn raw market data into structured insights and structured insights into smarter, more decisive action.


Twitter
Linkedin
Facebook