With the modern financial world, the ability to analyze and interpret the market data with the highest degree of accuracy and speed is becoming an important prime factor in the finance sphere. Be it as a trader, an asset manager, or a market analyst, access to market insight charts allows one to visualize complex data into more informed decisions. Market insight charts have turned a new page on professional interaction with market data, making sense of the complex and fast-moving environments. The world of data analytics is increasingly turning complex and sophisticated, and using the right charting tools and strategies becomes the key to staying ahead. This article explores some of the essential tools and strategies that would empower professionals to harness the full potential of market insight charts.
1. Why Professionals Rely on Market Insight Charts
Market insight charts are the handy reference of any financial professional, and for a number of reasons. This chart summarizes the big dataset into understandable visuals that help in quick and efficient decision-making. Following are the main reasons behind using these charts by pros:
- Data Simplification and Interpretation: Markets generate an enormous amount of data-price fluctuation, number of transactions to macroeconomic indicators. Insight charts summarize this information in usable formats that allow one to interpret it rather quickly.
- Identification of Trends and Patterns: One of the most striking advantages that come from market insight charts is the way they are able to depict historical and real-time data in manners that reveal trends and patterns. This consequently helps traders and analysts forecast further movements in prices and well in advance make the necessary adjustments to their strategies.
- Risk Management: This domain is immensely helped by being able to visualize the data through market insight charts. Based on key indications of volatility, price resistance levels, and moving averages, the professionals can better discern the risk factors and adjust their portfolios correspondingly.
- Real-Time Data for Instant Decisions: In times of high volatility, everything is about timing. Market insight charts ensure that professionals have real-time information to decide swiftly and effectively; of course, it’s much more important in the case of a day trader and asset manager, as they have really short time frames.
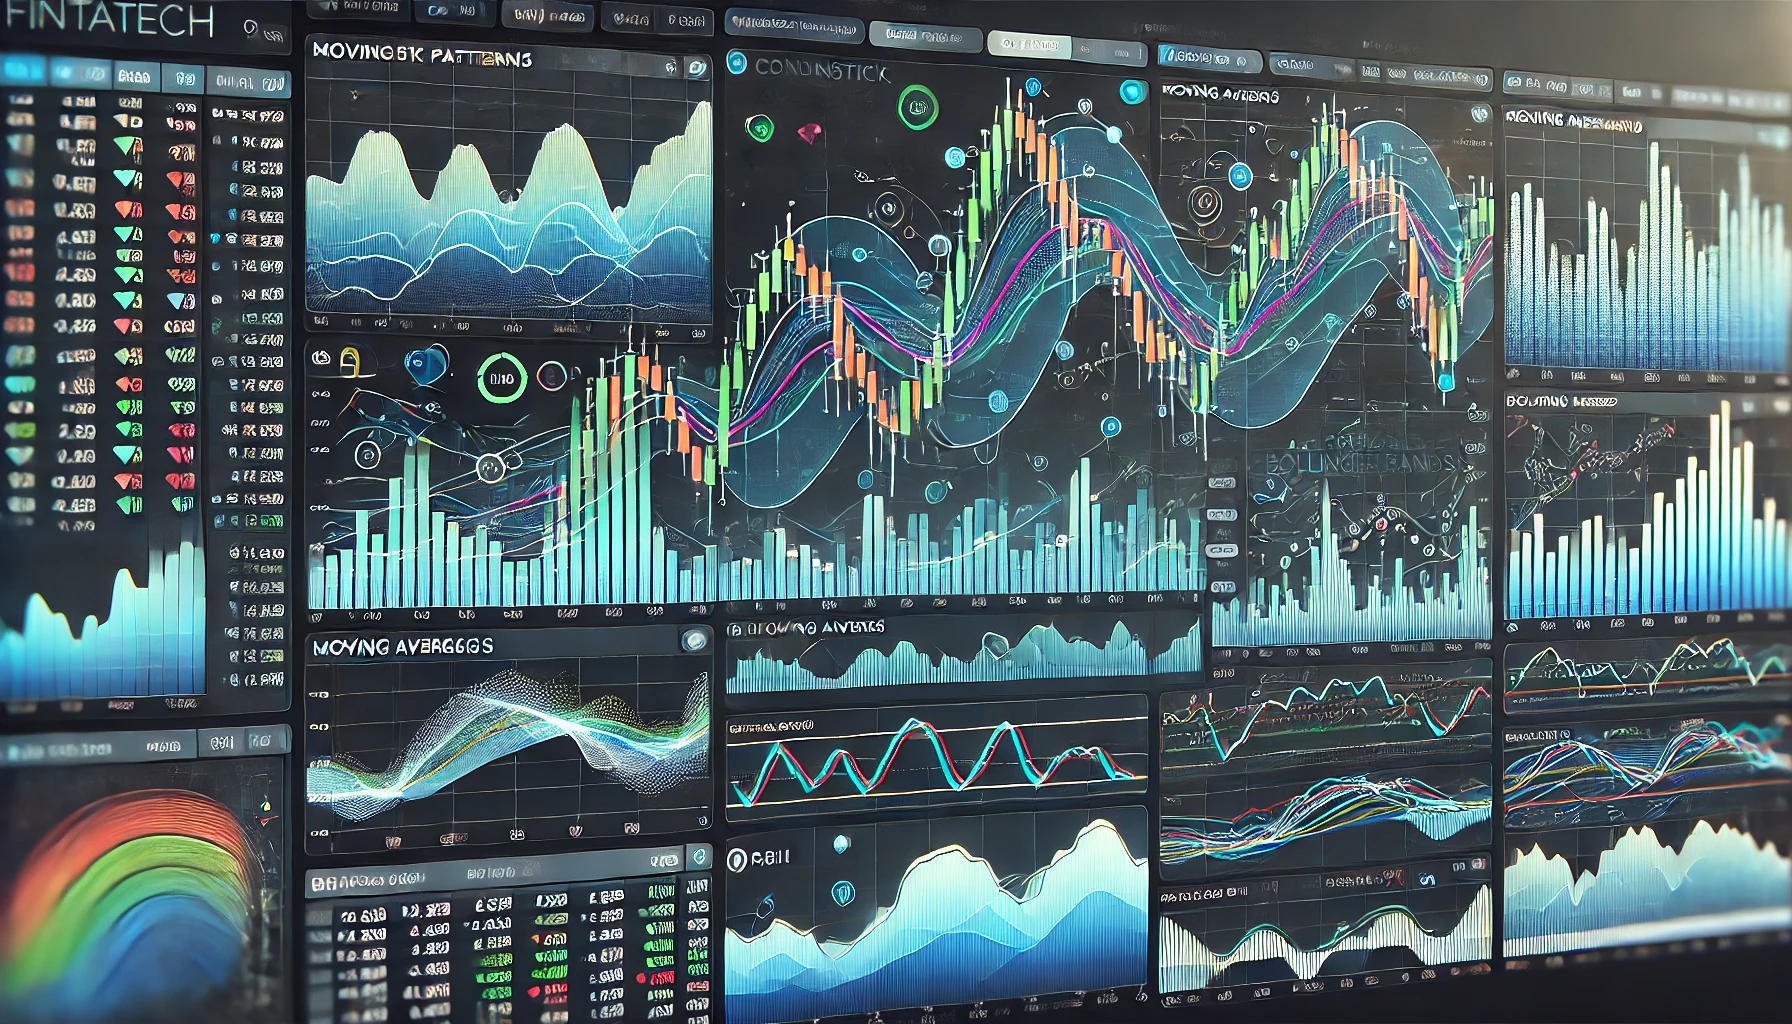
At Fintatech, we understand that professionals require not only accurate but also real-time data visualizations. Our platform offers customizable charting tools, real-time data feeds, and seamless cross-platform integration, ensuring that users can make fast, informed decisions with precision and confidence.
2. Essential Tools for Market Insight Charting
Selecting the right tools can make all the difference for professionals looking to optimize their market strategies. Fintatech provides a suite of advanced charting solutions designed to meet traders’, analysts’, and brokers’ needs.
Fintatech’s HTML5 Charting Software: Our Financial Charting Software in HTML5 is high-performance oriented with chart types and technical indicators that are customizable for real-time analyses. Key features include:
- Interactive User Experience: Seamlessness in user experience-enabling professionals to interact with charts in real-time.
- Customizable Indicators: From the simplest to the most complex, Fintatech’s software provides a long list of pre-set indicators like Moving Averages, RSI, and Bollinger Bands.
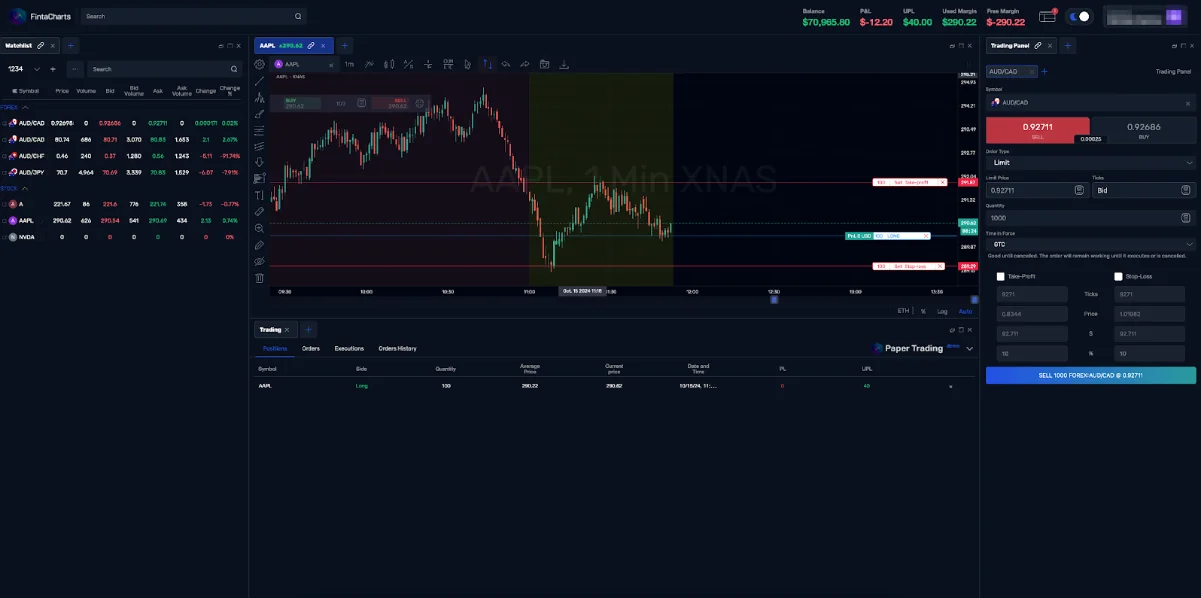
Cross-Platform Accessibility: Our tools are built with flexibility in mind. Charting software from Fintatech works across all major platforms: desktops, mobile phones, and the web. Professionals can, hence, monitor and analyze the movement at any place in the world.
API Integration: Often, professionals require customized solutions that exactly fit into their unique strategy. Our Chart API is seamlessly integrated with other platforms, allowing users to pull real-time data and customize the charts according to needs.
3. Key Charting Strategies for Professionals
The most successful market participants go beyond simple observation of data—they use sophisticated strategies to gain an edge. Here follow some key strategies professionals employ with market insight charts:
a. Technical Analysis
Technical analysis remains the cornerstone of professional market analysis. By studying historical price data and market trends, traders forecast future market conditions. The tools used to study the demand and supply forces acting on an asset include the following:
- Moving Averages (MA): It smoothes the price action, showing the direction in which the trend is moving.
- Bollinger Bands: These offer a deeper insight into market volatility, indicating overbought or oversold conditions in the market.
- Relative Strength Index (RSI): The RSI can be helpful in determining whether an asset is in overbought or oversold conditions.
b. Fundamental Analysis
The fundamental analysis employs market insight charts together with macro-economic indicators and financial data provided by a particular firm. This strategy is utilized by professionals to:
- Establish Market Health: Integrate prices of stocks or commodities with news items, earnings announcements, or economic announcements, pros establish long-term strategies based on intrinsic value and not short-term price swings.
c. Volume Analysis
Understanding the volume behind price movements can reveal market sentiment and strength:
- On-Balance Volume (OBV): Shows cumulative buying and selling pressure.
- Volume Weighted Average Price (VWAP): Helps professionals gauge whether prices are higher or lower than the average volume price, giving insight into price trends and market liquidity.
4. Advanced Tools for Enhancing Efficiency and Precision
For market professionals, efficiency and precision mean a lot economically, and Fintatech has more advanced features that give them an edge over others.
Algorithmic Trading and Automated Charting
Our charting solution can be integrated with any algorithmic trading platform for automation of strategy execution. This in turn helps reduce the time of manual monitoring significantly and makes the trader more responsive to market fluctuations.
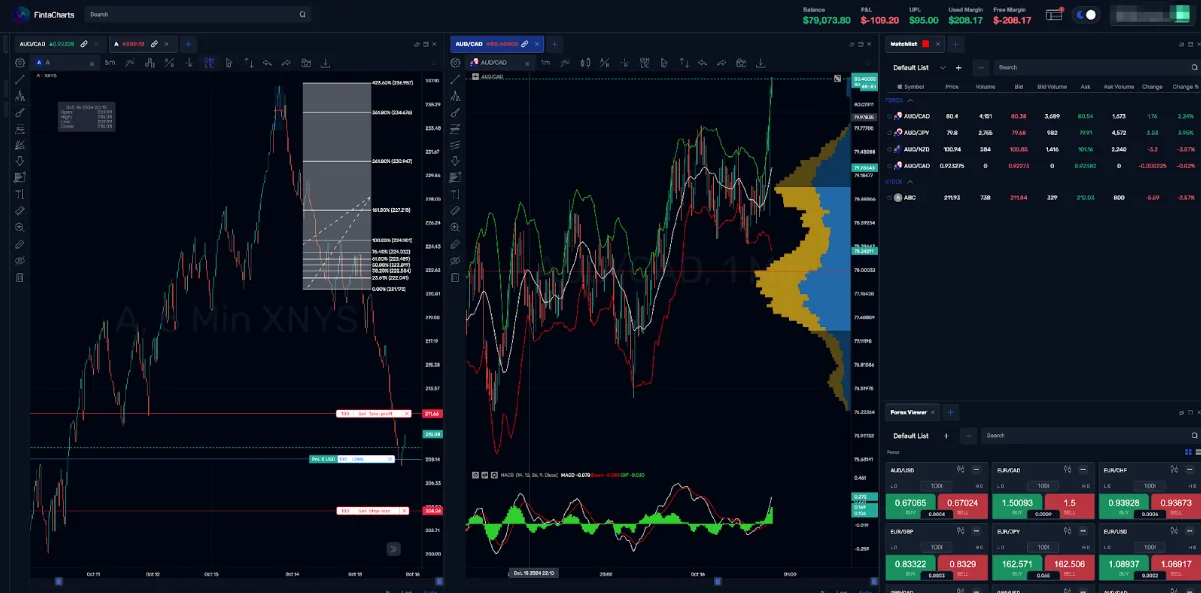
Backtesting Capabilities
Fintatech’s platform will let professionals backtest their trading strategies against historical data; that is, professionals will be able to prove their strategies and then work out the kinks before applying them to live markets.
The Mobile Solutions for On-the-Go Monitoring
Fintatech offers solutions for mobile platforms; so, professionals will always be able to observe the charts and markets in case they couldn’t be sitting in front of their working desk. Have the same results on your mobile platforms as are available on your desktop, and be connected to the market at all times.
Final Thoughts
In essence, the insight charts of the market promise so much at the fingertips of the professional, but this power is actually in the use. The right tools employed – from AI-powered platforms to advanced technical indicators, and adapting proven strategies from technical and fundamental analysis help a professional stay competitive in fast-moving markets.
Ultimately, success will depend upon the availability of data, but its interpretation and use in a timely manner. And as technology continues to evolve, so too will the tools and strategies available to financial professionals, ensuring theirs remain ahead in a data-driven world.


Twitter
Linkedin
Facebook