The knowledge of supply and demand zones is a crucial element in technical analysis. It offers valuable insights into market trends and price movements and can greatly improve your trading results.
In this article we will cover the basics of mastering supply and demand zones, discover the relevant tools, and define their benefits. So, let’s dive into this guide to unlock new possibilities in the world of trading!
Contents: Supply & Demand Zones
- Understanding Supply and Demand Zones
- Analysing Supply and Demand Zones
- Supply and Demand Trading Strategies
- Advanced Techniques for Supply and Demand Zones
- Common Mistakes and Pitfalls
- FAQ
Understanding Supply and Demand Zones
In basic economic terms – supply and demand are what fluctuates the price of products. Supply refers to the number of goods available to the customer and demand – to the needs for the goods. Consequentially, the higher the demand – the higher the price and the more supply is available on the market – the more likely the price to fall. The same principles apply to trading.
What are Supply Zones?
A supply zone is a price level area at which the traders usually sell. This is the area that is located above the current price, where the highest selling interest or potential lies. When the price hits a recognized supply price level, the unfilled sell orders get completed, consequentially bringing down the price.
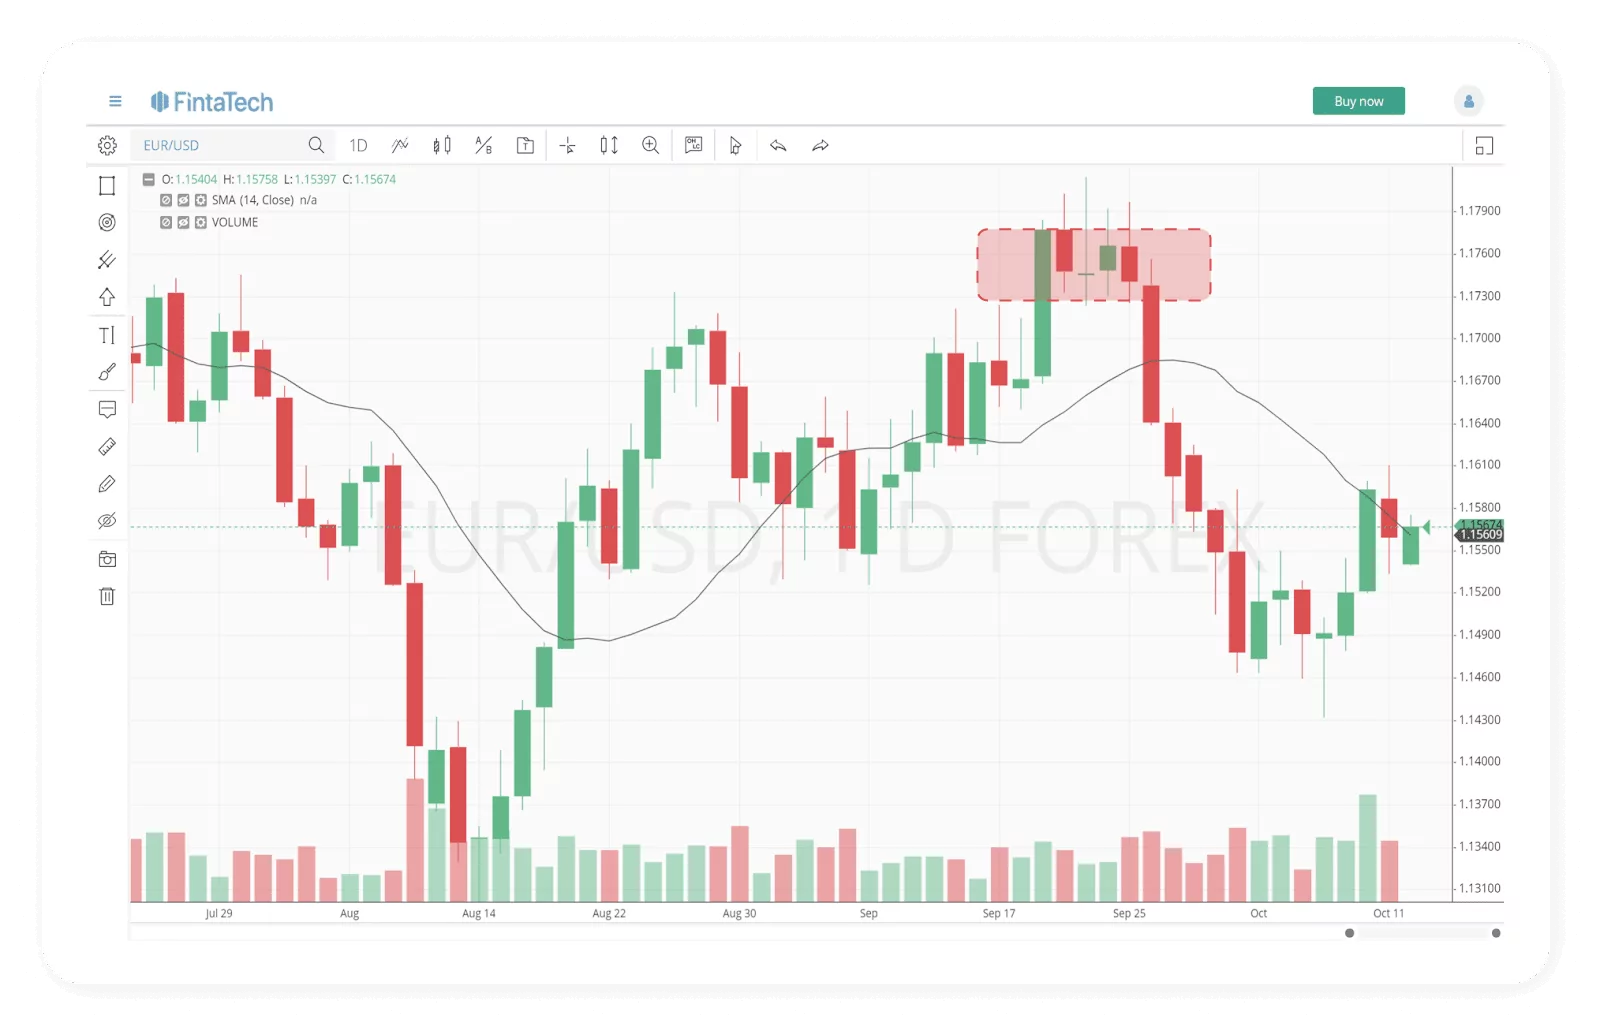
To find supply zones in a chart, you must study the chart and look for areas where the price had made a huge drop after a consolidation.
What are Demand Zones?
The demand zone is a price area with a high demand for the stock and buyers are ready to purchase at different levels. The demand zone is located below the current price level and has the highest buying potential.
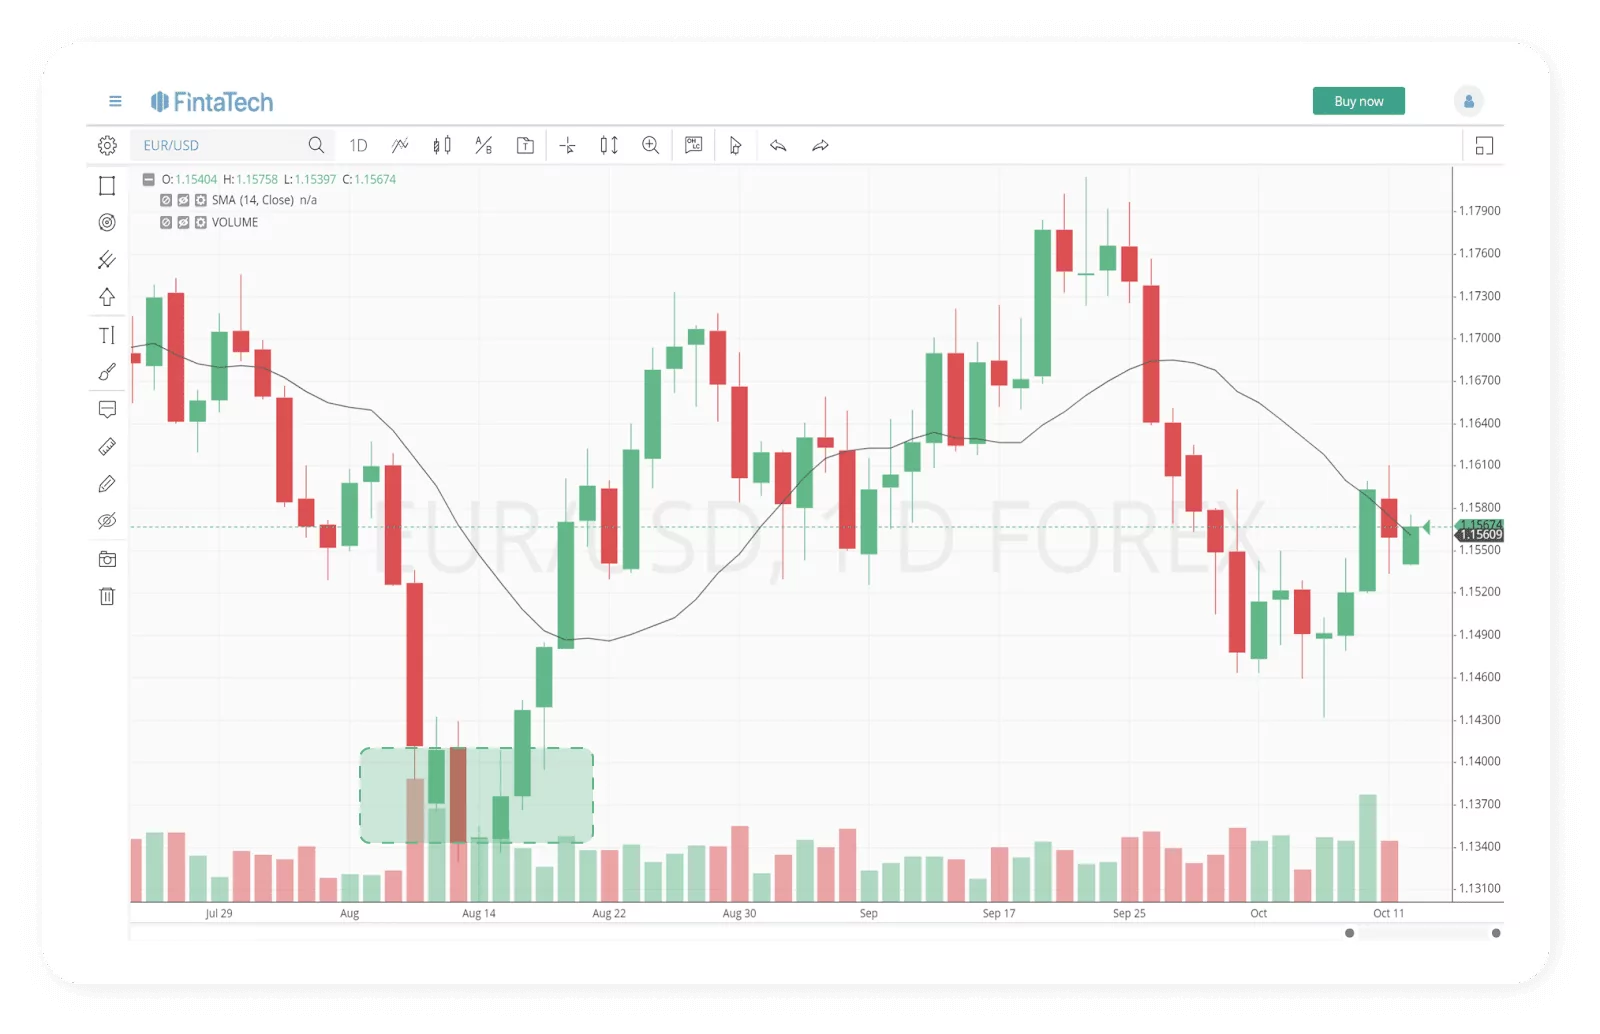
To define demand zones in a chart, you must analyse the chart and look again for areas where the price made an explosive move after a minor consolidation. It must be below the current price level to be a demand zone.
Analysing Supply and Demand Zones
Tools for Identifying Zones
Identifying supply and demand zones in the market can be facilitated by various tools and indicators. Here are some popular ones that traders commonly use:
Support and Resistance Levels:
At the foundation of zone identification lie support and resistance levels, acting as historical markers where price reversals have occurred.
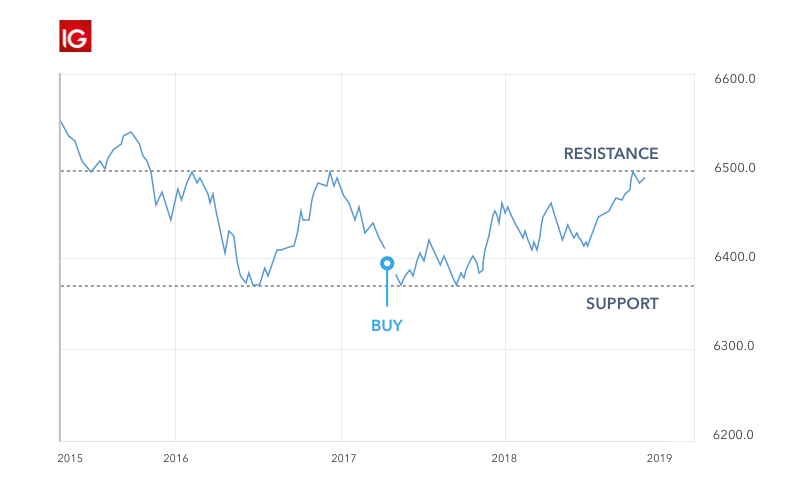
Traders draw horizontal lines at areas where the price has historically changed its direction, marking these zones as significant. These levels often become barriers for traders, reinforcing their importance in predicting future price movements.
Understanding the frequency at which the price touches these levels enhances their reliability in analysis:
- When a price touches or breaks through a support or resistance level but quickly reverses, it is considered a test.
- If the price sustains beyond the level for an extended period, it is likely to continue in that direction until a new support or resistance level forms.
Volume Profile Analysis:
An advanced tool, volume profile analysis, provides a graphical representation of traded volume at different price levels over a specified time period. This analysis reveals regions of substantial trading activity, indicating potential supply and demand zones that attract market interest.

By using data from lower timeframes, volume profile indicators calculate the volume traded at specific price levels during the specified time period and divide it into:
- Up volume (trades that moved the price up).
- Down volume (trades that moved the price down).
This information becomes visible through a volume profile histogram, guiding traders towards significant price levels.
Fibonacci Retracement:
Traders also turn to Fibonacci retracement levels to identify potential supply and demand zones based on the natural retracement levels after a price move. Derived from the Fibonacci sequence, these ratios (23.6%, 38.2%, 50%, 61.8%, 78.6%, 100%, 161.8%, 261.8%, and 423.6%) indicate areas where a stock may reverse or stall.
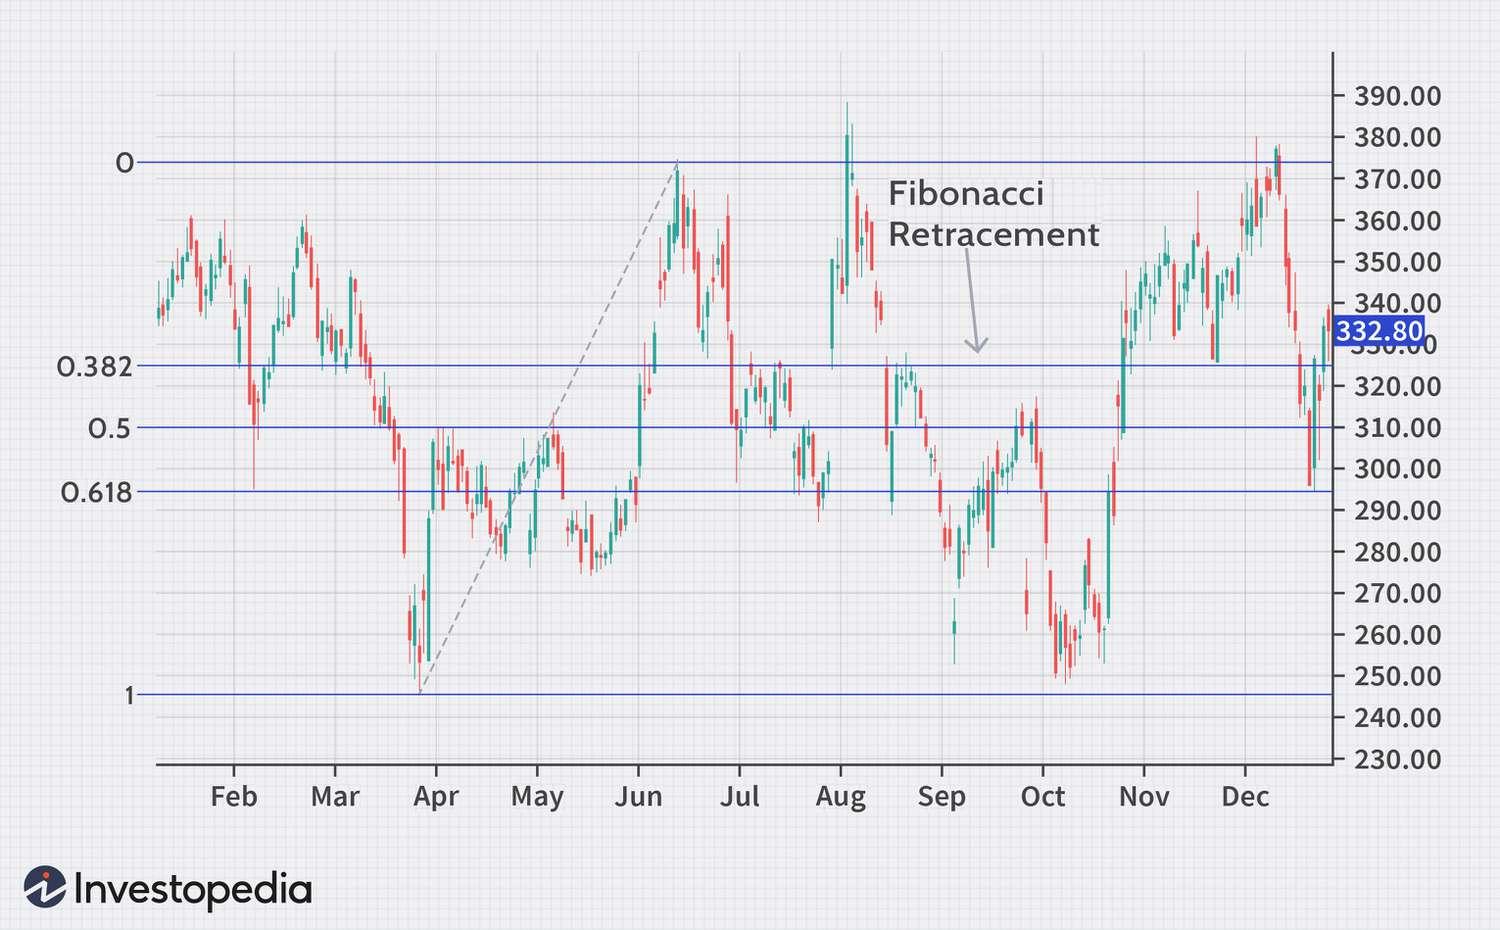
By drawing trend lines between two significant points on a chart, traders can intersect horizontal lines at Fibonacci levels, pinpointing potential zones for support and resistance.
Multiple Timeframe Analysis for Stronger Zones
Analysing Across Timeframes:
Understanding supply and demand zones across various timeframes adds robustness to the analysis. Zones that align on multiple timeframes hold greater significance, indicating stronger market sentiment.
Traders can validate potential zones using data from different timeframes, enhancing the precision of their predictions.
Continuously Refining the Analysis:
Supply and demand zones are not static, and they evolve with changing market conditions. Traders must continuously update and refine their analysis to adapt to new information and stay ahead in the ever-changing market landscape.
Remember that no single tool or indicator is foolproof, and combining multiple methods can yield more robust results. It’s essential to conduct thorough analysis and validate potential supply and demand zones using different tools for a better understanding of the market.
Supply and Demand Trading Strategies
Zone-Based Price Action Trading
Zone-Based Price Action Trading is a trading strategy that focuses on analysing price action within specific zones on a price chart. The strategy involves identifying key levels or zones where price tends to react significantly, and then making trading decisions based on the price behaviour within those zones.
Let’s break down some of the main components of this trading approach:
1. Reading Price Action within Zones:
Price action refers to the movement of a financial instrument’s price over time, represented on a chart.
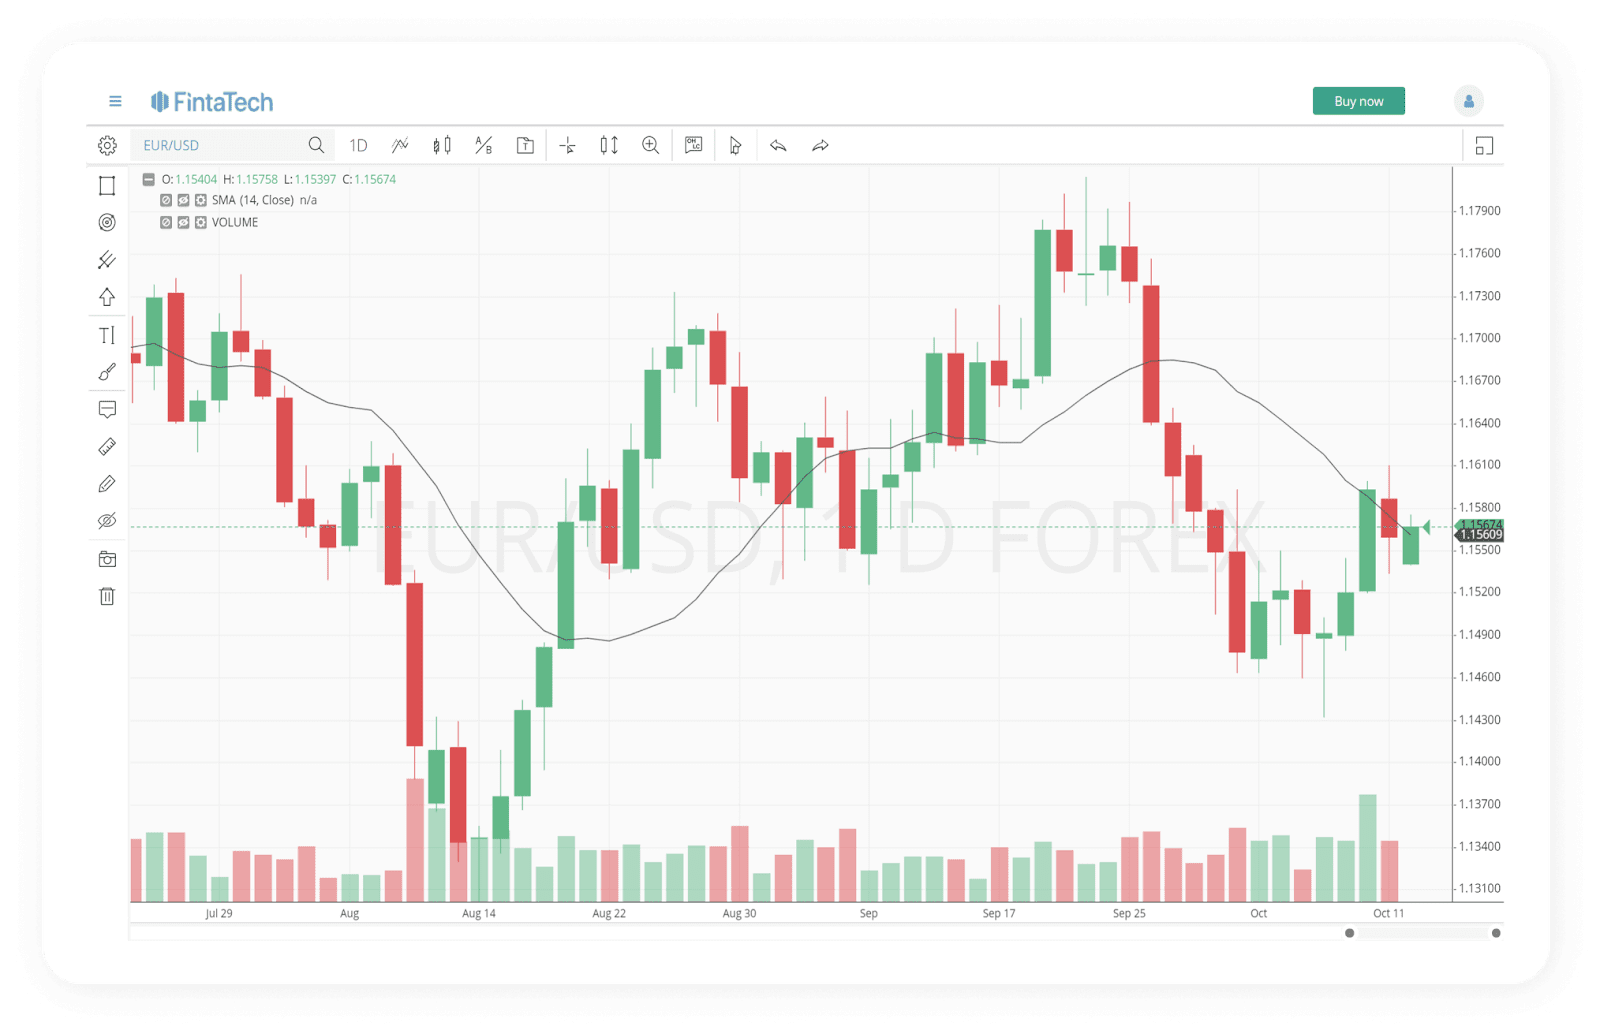
In zone-based price action trading, traders look for areas on the chart where price has historically reacted or consolidated. These areas can include support and resistance levels, trendlines, chart patterns, and other significant price zones.
By studying the price action within these zones, traders attempt to gauge the potential future price movement and make informed trading decisions.
2. Entering and Exiting Trades with Precision:
Once traders identify a relevant zone, they watch for specific price action patterns that could mean a potential entry or exit point for a trade. This includes reversal patterns like pin bars, engulfing patterns, or momentum continuation patterns like breakouts.
The goal is to enter trades with a high probability of success, based on the historical behaviour of price within the identified zones.
3. Managing Risk and Setting Stop Loss Levels:
Risk management is a crucial aspect of any trading strategy.
In zone-based price action trading, traders typically place their stop-loss orders just beyond the boundaries of the identified zones. This means that if the price moves against the expected direction, the trade will be exited before it hits a predetermined maximum loss.

By setting stop-loss levels based on the zones, traders aim to minimize potential losses and protect their capital.
It’s important to note that zone-based price action trading does not always have predefined rules. Traders may incorporate various technical analysis tools and indicators to complement their price action analysis.
Supply and Demand Zone Breakout Strategy
The Supply and Demand Zone Breakout Strategy is a popular trading approach that focuses on identifying key supply and demand zones on a price chart and trading the breakouts that occur when price moves beyond these zones.
The strategy is based on the concept that significant price movements often happen when price breaks out of strong support or resistance levels.
Here’s how the strategy works along with risk management techniques:
1. Identifying Zone Breakouts and Trading Techniques:
To identify supply and demand zones, traders look for areas where price has previously reversed or stalled, creating clearly defined support and resistance levels. There are various ways to identify these zones, including using swing highs and lows, trendlines, and volume analysis.
Once the zones are identified, traders then watch for potential breakout opportunities. A breakout occurs when price moves beyond a supply or demand zone, indicating a potential continuation of the trend.
Traders may use various entry techniques, such as entering on the close of a breakout candle or waiting for a pullback to the breakout zone to confirm its strength before entering the trade.
2. Risk Management for Breakout Trades:
Risk management is crucial in any trading strategy, and breakout trades are no exception. Since breakouts can lead to volatile price movements, risk management becomes even more important to protect against potential losses. Here are some risk management techniques to consider:
- Position Sizing: Determine the appropriate position size based on your trading capital and risk tolerance. A common rule of thumb is to risk only a small percentage (e.g., 1% to 2%) of your trading capital on any single trade.
- Stop Loss Orders: Place a stop-loss order just below the breakout level for long trades (demand zone breakouts) and just above the breakout level for short trades (supply zone breakouts). This helps limit potential losses if the breakout fails and price reverses.
- Trailing Stop Loss: As the trade moves in your favor, consider using a trailing stop-loss order that adjusts upward (for long trades) or downward (for short trades) to lock in profits and protect against sudden reversals.
- Take Profit Targets: Identify potential take profit levels based on previous price action or technical analysis tools. Taking profits at predefined levels can help secure gains and prevent giving back profits if the price retraces after a breakout.
- Avoid Overtrading: Stick to your trading plan and avoid entering multiple breakout trades simultaneously. Overtrading can lead to increased risk and reduced focus on each individual trade.
As with any trading strategy, it’s essential to test the Supply and Demand Zone Breakout Strategy in a demo or simulated environment before implementing it in live trading.
Additionally, traders should continually review and adapt their risk management approach based on their trading performance and market conditions.
Common Mistakes and Pitfalls
Overlooking Key Factors When Identifying Zones
Identifying supply and demand zones on a price chart can be challenging, and traders often encounter these common errors during this process:
- Absence of Fast Move: One of the most common mistakes is drawing a zone where there was no fast move. A Supply or Demand zone must start with a fast move – it indicates the imbalance in the market and an urgency to go up or down.
- Overlooking Historical Data: Failing to consider sufficient historical data may lead to the omission of critical price levels and result in incomplete zone identification.
- Subjectivity Bias: Allowing personal biases or emotions to influence zone identification might lead to inconsistencies and unreliable zones.
- Disregarding Timeframes: Zones can vary on different timeframes, and failing to consider this aspect might lead to inconsistent zones across charts.
- Trading Old Zones: Identifying zones that were relevant in the past but have lost their significance in the current market conditions can lead to poor trading decisions.
To improve zone identification and usage, traders should use a systematic approach, consider multiple timeframes, and ensure objectivity in the process. Continuous practice and learning from past mistakes are crucial for enhancing zone identification skills.
Additionally, traders should practice disciplined risk management and continuously evaluate the effectiveness of their strategy to adapt to changing market conditions.
Avoiding Confirmation Bias in Analysis
In general, confirmation bias is a tendency that leads people to favor information that confirms their preexisting hypotheses while disregarding or downplaying information that contradicts them.
Undoubtedly it can greatly affect many areas of life as well as decision-making and analysing.
To lower the effect of confirmation bias while making technical analysis in trading you must remember to pay attention to facts that contradict your theory.
One of other common mistakes with supply and demand zones is relying specifically on them, without noticing other results.
Having more trading tools in your arsenal will help you to consider all the aspects when performing technical analysis.
Emotional Trading and Impulsive Decisions
Imagine yourself watching the stock market ticker as prices are fluctuating vastly. To sell or not to sell – that’s the real question. You are keen on winning this battle, but the panic is real and makes you constantly question your decisions.
Do you recognise yourself in this behaviour? If your answer is no, feel free to scroll down, you are the true Jedi of trading. Otherwise, let’s dive into why we are so keen on disregarding all our strategies in these moments and conquer our fears together.
Emotional trading often results in dramatic losses and instability on the market. That’s why keeping critical thinking and clear mind is incredibly important for the long game in trading. So, how to achieve emotional stability in the moments of doubt?
Keeping yourself educated: Having the confidence in the knowledge of market trends and strategies can make a huge difference when making a rapid decision.
Experience is key: Undoubtedly, relying on your own experiences is very effective and can keep you calm when the panic tries to interfere with your plans.
Well-defined plan: Defining a clear strategy and keeping to it will make the impacts of emotional trading less critical and keep you focused on your goal.
Conclusion
Understanding the supply and demand zones is a relatively easy and can have a big impact when used properly. It is a valuable concept in forex trading as it provides insights into potential areas of buying or selling interest. When identifying these zones, traders can anticipate price reversals and make analytical trading decisions.
Gaining the advantages of using supply and demand zones you can expect clear reference points for trading decisions, identify potential areas of high trading activity, and enhance risk management. Having said that, the concept of supply and demand zones might be sometimes subjective, don’t forget to account on other techniques to achieve the expected results.Follow us on https://fintatech.com/ to keep updated on other useful tutorials and check out FintaTech’s products to upgrade your trading game.
FAQ
What are supply and demand zones?
Supply and demand zones are areas on a price chart with the occurrence of a significant buying or selling activity. These zones indicate areas of potential supply (resistance) or demand (support).
How do I identify supply and demand zones?
To identify supply and demand zones, you must study the price chart and look for the areas where the price has repeatedly reversed its direction. These areas often represent zones of imbalance between supply and demand.
What is the concept of supply and demand in trading?
The concept of supply and demand in trading emphasises the relation between buyers (demand) and sellers (supply). If demand is higher than supply, prices tend to rise, and if supply exceeds demand – prices tend to fall.
How can I find supply and demand zones?
To find supply and demand zones, you can use various methods and techniques such as analysing price action, drawing support and resistance levels, and using indicators. These tools can help you pinpoint potential zones where prices may react.
What is the importance of supply and demand zones in forex trading?
Supply and demand zones are valuable in forex trading since they define areas of buying or selling interest. When identified, these zones can help to anticipate price reversals and make informed trading decisions.
What trading strategies can I use with supply and demand zones?
Several trading strategies can be used to utilize supply and demand zones, such as: range trading, price action trading, and supply and demand zone trading. They involve identifying zones and using them to define entry and exit points.
How do I draw supply and demand zones on a price chart?
To draw supply and demand zones on a price chart, examine regions of consolidation or instances where the price has experienced multiple reversals. Connect these areas using horizontal lines to establish the zones, which can then serve as valuable reference points for making trading decisions.
What are the pros and cons of using supply and demand zones?
Using supply and demand zones offers several benefits, such as providing distinct reference points for making trading decisions, pinpointing areas with potentially high trading activity, and improving risk management. Nevertheless, a downside to consider is that these zones can be subjective and may not consistently behave as anticipated.


Twitter
Linkedin
Facebook