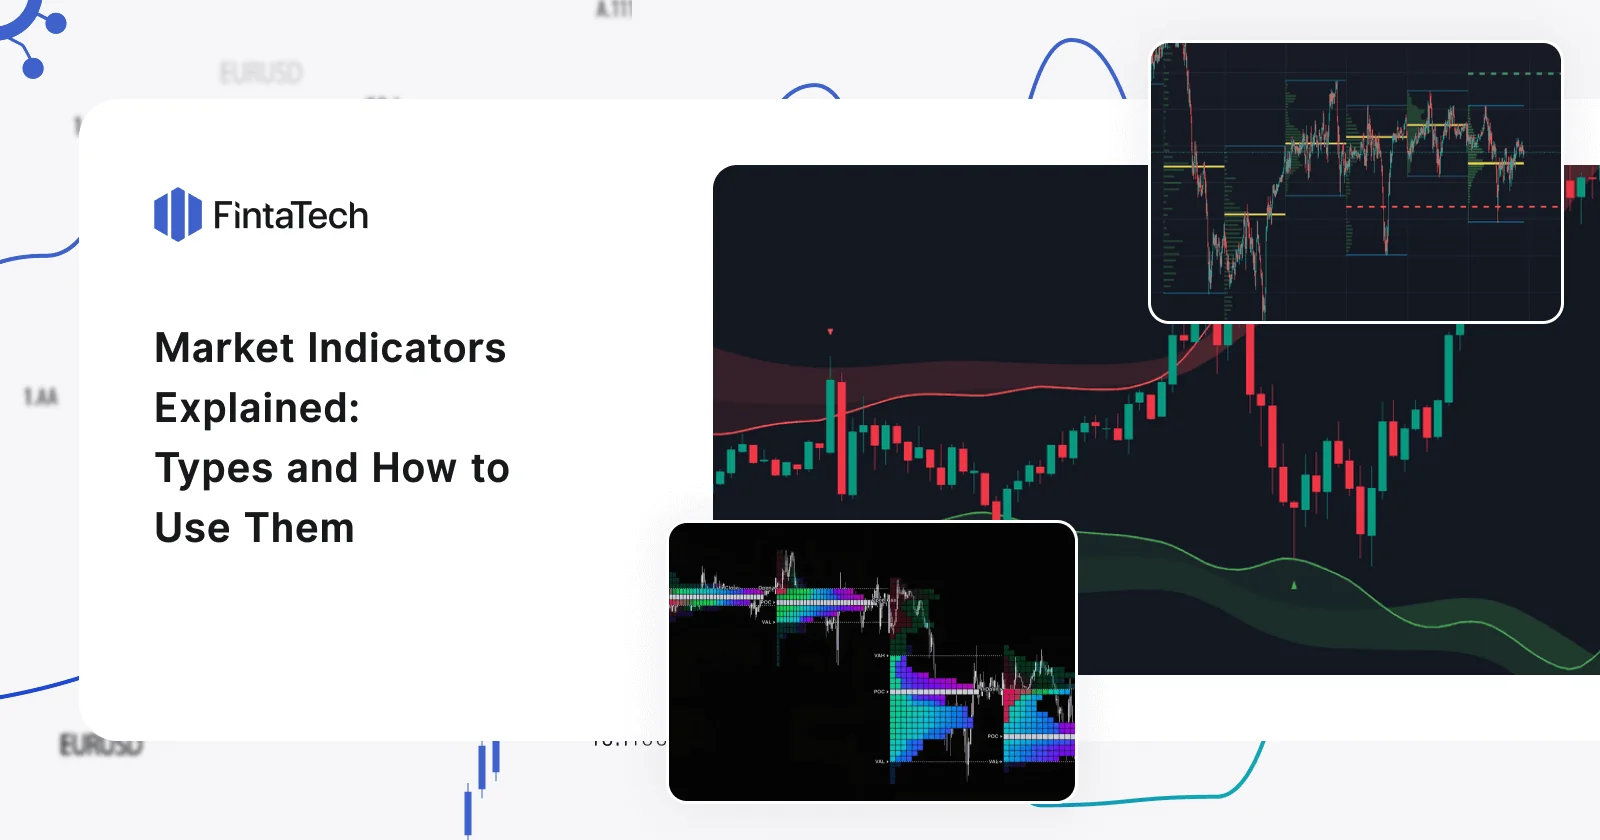
Swing trading is an intriguing trading strategy that offers wide profit opportunities through short- to medium-term price movements. However, to effectively navigate these market swings, it’s essential to understand the right indicators. In this article, we will discover the top indicators for swing trading, including moving averages, RSI, and volume.
By providing valuable insights on how to leverage these indicators to your advantage, we aim to simplify your trades and enhance your decision-making process. Join us as we explore how these indicators can empower your swing trading, unlocking their potential for success.
What is Swing Trading?
Swing trading is a strategy that aims to make profits from price movements within a larger trend. Unlike day trading, swing traders hold their positions for longer periods based on shifts in momentum. Indicators are important tools that help traders identify these opportunities and confirm trends.
Swing trading indicators are mathematical models that help traders understand market trends and predict how stocks will move. These indicators provide insights into whether a stock is likely to go up, down, or remain stable. They help traders make accurate predictions, assess potential gains or losses, and determine the best times to enter or exit trades.
Pros and Сons of Swing Trading
Swing trading offers several advantages that make it an attractive trading strategy. Let’s explore some of the key benefits:
- Time Commitment: Swing trading requires less time compared to day trading. Daily timeframes are primarily used for technical analysis, with occasional shifts to lower timeframes for better entry points. This allows for a more manageable trading schedule, requiring only a few minutes each day for analysis.
- Part-Time Trading: Swing trading can be pursued alongside other commitments, such as a full-time job or business. Its flexibility allows traders to generate additional income without compromising their primary responsibilities. This can lead to a calmer trading mindset and reduce the pressure to make quick profits.
- Profit Potential: With a well-developed strategy and effective risk management, swing trading can be highly profitable. Consistent implementation of the strategy can result in significant returns, often surpassing the market average. Traders can expect annual profit ranges of 10-50%, making swing trading an attractive option.
- Capital Flexibility: Swing trading offers greater flexibility in managing capital compared to long-term trading. If a trade is not performing as expected, traders can exit with a small loss and allocate funds to another stock with a favorable setup. This adaptability ensures that capital is continuously working to generate profits.
However, swing trading also has its cons that need consideration:
- Exposure to Price Gaps: Holding trades overnight or over the weekend exposes traders to price gaps caused by after-hours trading or market news. These gaps can render stop-loss orders ineffective, increasing risk. To mitigate this, traders can opt for smaller trade sizes without leveraging.
- Missed Opportunities: Focusing on individual price swings may cause traders to overlook exceptional stocks with long-term growth potential. Stocks like Amazon, Apple, and Tesla have demonstrated significant returns over time, which swing traders may miss by focusing on shorter-term movements.
- Market Timing Difficulty: Timing market swings accurately is challenging, even for experienced traders. Beginners face even greater difficulty in predicting and capitalizing on market movements, requiring substantial skill and experience.
- Accumulated Trading Costs: While swing trading generally incurs lower costs than day trading, expenses can accumulate over time. Multiple trades can result in significant trading costs, especially when compared to long-term investing, where trades are held for months or years.
Understanding the benefits and challenges associated with this strategy will enable traders to make informed decisions and develop effective risk management plans.
Best Іndicators for Swing Trading
Now that we’ve learned about the basics of swing trading, let’s explore the essential swing trading indicators, that can be effective in identifying profitable trading opportunities.
Moving Average Indicator (MA)
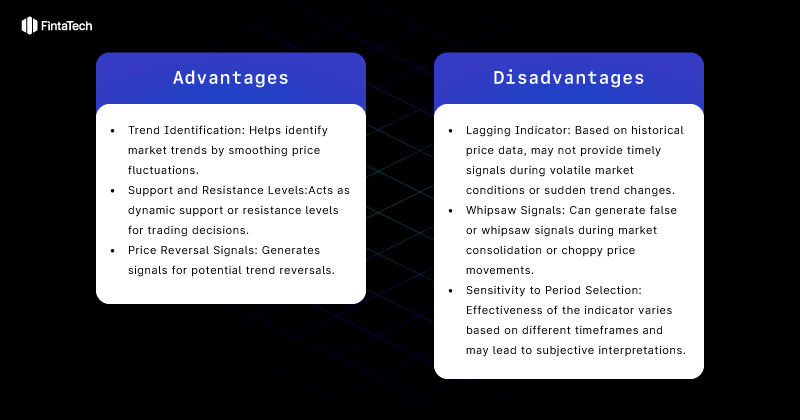
Moving averages are useful tools in swing trading as they calculate the average price of an asset over a specified period, providing a smoother view of price movements. Rather than predicting trends, they serve as lagging indicators that confirm existing trends. Traders have the option to choose between different types of moving averages, such as simple moving averages (SMAs) and exponential moving averages (EMAs). SMAs give equal weight to all data points, while EMAs emphasize recent price data.
The MACD (Moving Average Convergence Divergence) indicator is more advanced and combines SMAs and EMAs. It not only confirms trends but also offers insights into momentum. By comparing the EMA and SMA, traders can identify potential entry or exit points. Moreover, the MACD can be utilized to predict reversals by examining the divergence between the histogram and price action.
Volume
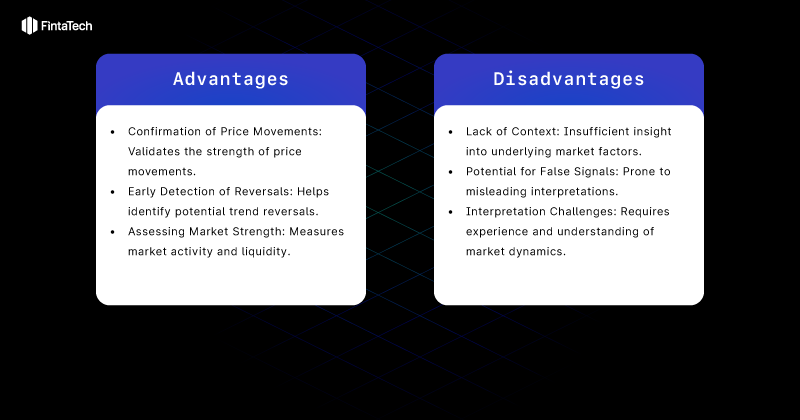
Volume is a crucial factor in swing trading as it provides insights into trend strength. Higher volume indicates stronger market conviction, while low volume suggests weaker trends. Breakout strategies benefit from volume analysis as breakouts are often accompanied by spikes in volume, validating the emerging trend.
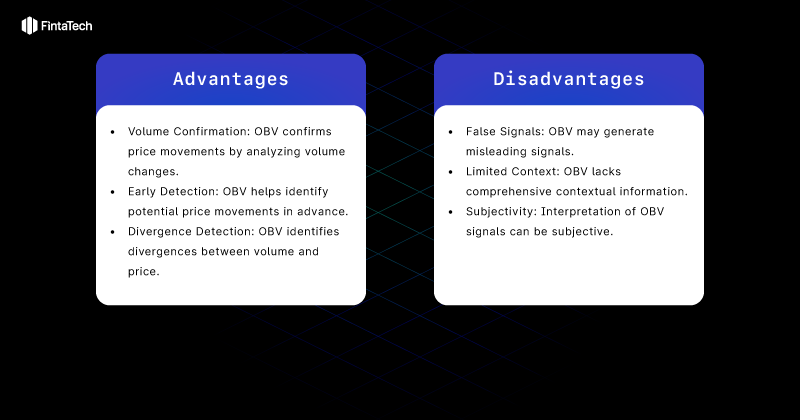
The volume confirmation strategy involves identifying potential trends or signals and analyzing volume to confirm their validity. This strategy offers advantages such as confirming trend strength, early detection of reversals, and increased confidence in trade decisions.
However, the volume indicator has limitations. It may lack context as it doesn’t consider external factors influencing market activity. False signals can occur, requiring additional analysis for confirmation. Interpretation of volume patterns requires experience and understanding of market dynamics, posing challenges for novice traders. It’s important to combine the volume indicator with other tools for comprehensive analysis and informed trading decisions.
Relative Strength Index (RSI)
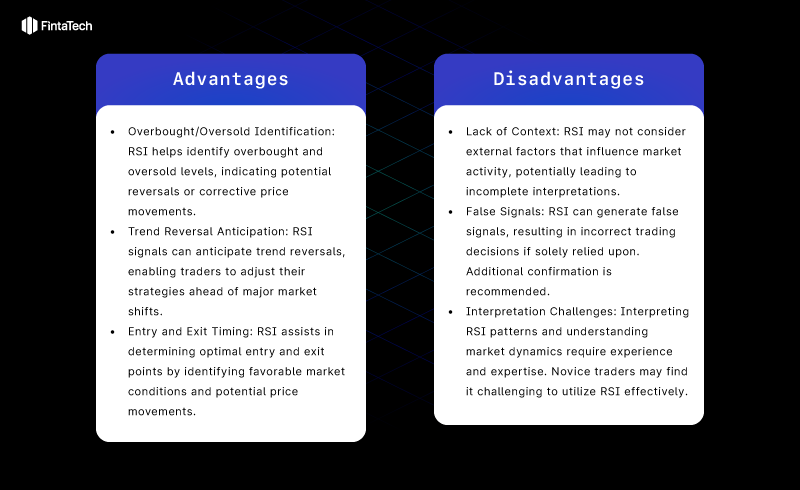
The Relative Strength Index (RSI) is a popular momentum indicator used by swing traders to identify potential price oscillations within a broader trend. It measures the number and size of positive and negative price closes over a specific period, typically 14, and is represented as an oscillator ranging between zero and 100.
The RSI is particularly favored in crypto trading and provides insights into whether a stock or cryptocurrency is overbought or oversold based on the magnitude of price changes. A higher RSI value indicates an overbought condition, while a lower value suggests an oversold condition.
Swing traders use the RSI to make timely trading decisions. When the RSI climbs above 70, it suggests the asset is overbought and a reversal may be imminent. Conversely, when the RSI drops below 30, it indicates an oversold market and signals a potential end to the bearish trend.
On-Balance-Volume (OBV)
On-Balance Volume (OBV) is a technical indicator that utilizes changes in volume to forecast price movements. Unlike other indicators that primarily focus on price data, OBV emphasizes the importance of volume as the driving force behind markets. The concept behind OBV is that significant increases or decreases in volume, without corresponding changes in price, can signal future price movements. In other words, if volume rises sharply while the price remains relatively stable, it suggests that the price will eventually follow the direction of the volume surge. However, it’s important to note that the OBV indicator is not foolproof and can generate false signals. To mitigate this risk, traders often combine OBV with lagging indicators to enhance its accuracy and reliability.
Bollinger Bands (BB)
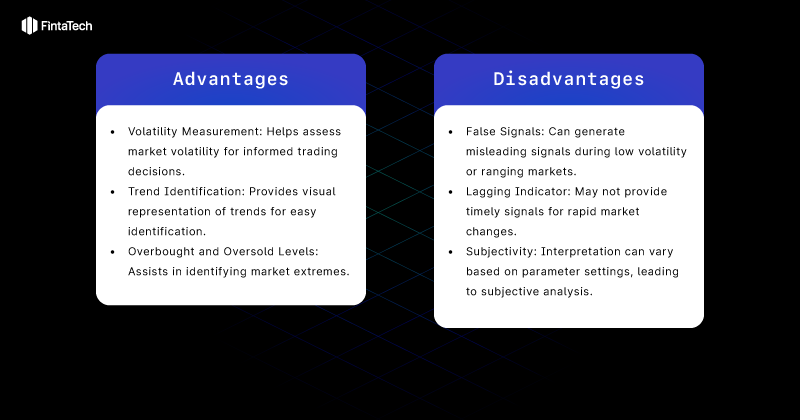
Bollinger Bands (BB) is a widely-used momentum indicator that provides valuable insights for swing traders. This indicator consists of three lines: a middle line representing a 20-day simple moving average (SMA), and two outer lines representing standard deviations from the middle line. The primary purpose of Bollinger Bands is to assess the “highness” or “lowness” of prices relative to previous trades, helping traders determine market volatility and overbought or oversold conditions. When volatility is high, the bands expand, indicating wider price spreads away from the middle line. Conversely, in periods of low volatility, the bands contract, reflecting narrower price spreads towards the middle line. By observing the width of the bands, traders can gauge market volatility levels. Swing traders appreciate the simplicity and clarity of Bollinger Bands, as they offer quick identification of trends, overbought and oversold levels, and changes in market volatility. Incorporating Bollinger Bands into trading strategies can provide valuable momentum insights, allowing traders to make informed decisions.
What Helps to Іnterpret Іndicator Signals
In order to improve the quality of signals to enter the trade and reduce the number of losing trades traders use additional tools. Some commonly employed methods include:
Support and Resistance
Support and resistance levels are significant areas on a market’s chart that pose challenges for price movement. They are fundamental components of technical strategies, including swing trading. When the price approaches a support level, it tends to attract buying interest from traders, leading to a bounce back up. On the other hand, when the price encounters a resistance level, selling pressure increases as traders take profit, causing the market to move downward. Recognizing these levels is valuable for timing trade entries and exits near potential reversals. The significance of a support or resistance line strengthens with each successful rebound or rejection. If the price manages to break through these levels, it often indicates a significant change in market direction, known as a breakout.
For swing traders, closely monitoring support and resistance levels that cryptocurrencies struggle to overcome is crucial. A resistance level acts as an imaginary upper boundary that price fails to surpass, often resulting in a decline once it touches that level. Otherwise, a support level represents an imaginary line formed by recent lows, where the price tends to halt its decline and reverse upward. By paying attention to these levels, swing traders can anticipate price reversals and make well-informed trading decisions.
Chart Patterns
Patterns play a crucial role in swing trading as they provide valuable insights into potential price movements. Here are some commonly observed patterns that traders should consider:
- Wedges: Wedges are patterns that indicate reversals. A falling wedge in a declining market or a rising wedge in a rising market suggests an upcoming price reversal. Traders pay attention to the narrowing price range within the wedge, which signals a potential change in the prevailing trend.
- Standard Head and Shoulders: The standard head and shoulders pattern is a reversal pattern that can lead to bear markets. It consists of three peaks, with the central peak (the head) being the highest, flanked by two lower peaks (the shoulders). Traders interpret this pattern as a potential reversal from a bullish trend to a bearish one.
- Triangles: Triangles are patterns that suggest potential breakouts. These patterns form when the price moves within converging trendlines, creating a triangular shape on the chart. If the price breaks out of the triangle, it is seen as a precursor to a significant price movement.
- Pennants: Pennants are consolidation patterns that often precede breakouts. They occur when a market consolidates after experiencing significant price action. The converging trendlines of a pennant pattern indicate a temporary pause before a potential continuation of the previous trend.
On the other hand, the inverse head and shoulders pattern is a reversal pattern that can lead to uptrends. It features three troughs, with the central trough (the head) being the lowest, surrounded by two higher troughs (the shoulders). This pattern indicates a potential reversal from a bearish trend to a bullish one.
By recognizing and analyzing these patterns, swing traders can enhance their ability to identify potential reversals, breakouts, and changes in market trends. It is important to supplement pattern analysis with other technical tools and consider relevant market factors to make well-informed trading decisions.
FAQ
How much money needed for swing trading?
The amount of money needed for swing trading can vary depending on factors like the trading platform, the market you’re trading, and your risk tolerance. Still, it is important to have enough funds to cover potential losses and meet any margin requirements that may come up during your trades.
Does swing trading really work?
Swing trading, with its effective trading strategies, can generate substantial profits. Although the target profit range for each swing trade is usually around 5-10%, reinvesting these gains in new stocks can quickly grow your portfolio. It’s noteworthy that swing trading prioritizes shorter timeframes, aiming for fast profits within days instead of pursuing larger returns over longer periods like traditional position trades.
Can you live off swing trading?
Swing traders have different income possibilities. Some may need an additional income source, while others can earn a secondary income or even make a living solely from trading. However, it’s crucial to understand that consistent and substantial income from swing trading requires advanced trading skills, experience, and effective risk management.
How long should you hold a swing trade?
Swing trading usually means keeping a trade open for more than one day, but not for too long, usually a few weeks or a couple of months. However, the exact time can vary, as some swing trades may last longer than a couple of months and still be considered as swing trading.
Can you make $100 a day trading crypto?
Making $100 a day through day trading is indeed achievable for skilled traders who employ effective strategies and capitalize on favourable market conditions. With a combination of knowledge, experience, and disciplined trading practices, traders have the potential to consistently generate profits.
Сonclusion
Swing trading offers a secure and straightforward method of generating income by leveraging market trends, without the need for complex strategies. With its shorter trade duration, there is an increased likelihood of achieving success. Moreover, swing trading allows for flexible trading approaches that can be personalized to individual preferences. By utilizing a variety of swing trading indicators, traders can execute precise and profitable trades. However, it’s important to note that swing trading may not be suitable for inexperienced traders, as it requires knowledge and understanding of market dynamics.
If you’re interested in exploring swing trading further to enhance your strategies, contact Fintatech Trading Software Development Company (https://fintatech.com/contact/). Our team of experts specializes in creating advanced trading solutions relying on your specific needs, enabling you to maximize your trading potential.


Twitter
Linkedin
Facebook